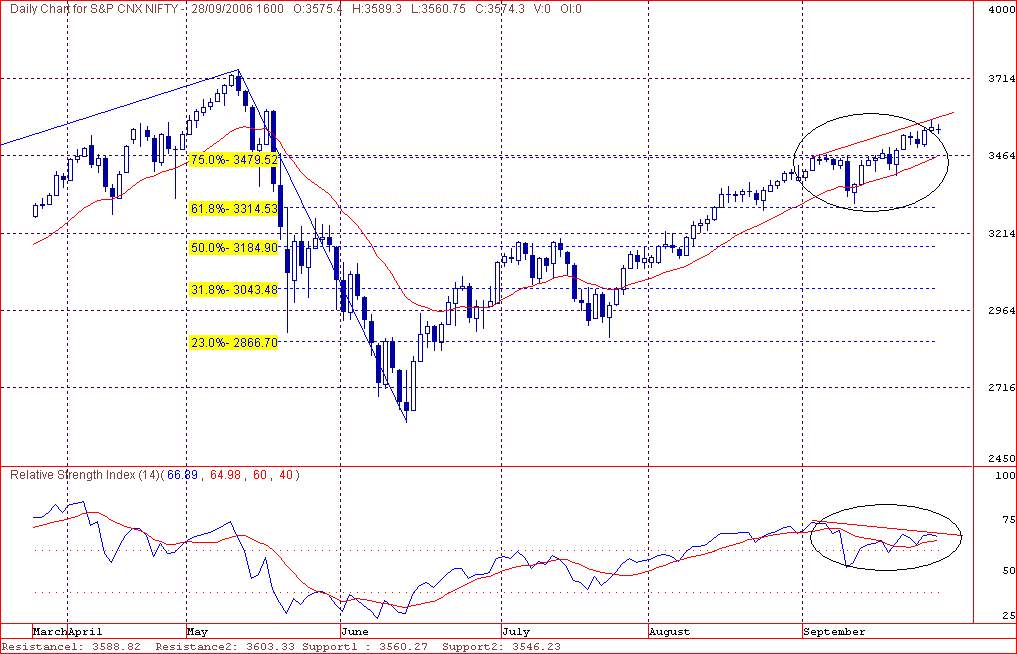
Looking at the chart of Nifty, we find that the low made today is lower than the low yesterday. But that is not the only point on which I base my comment. Looking at the encircled areas on the chart, we find that the Nifty is making newer highs while the RSI has made a lower high. This is known as a bearish/negative divergence which, generally, leads to a fall in prices.
But a fall in prices is not confirmed right now. However, there are certain levels which will signify a further fall in prices. The first and the closest level to watch is 3514, which not only happens to be the lowest price 3-4 days back, but also is the point where the trendline, connecting troughs made in Mid-June, mid-July and now mid-September, will provide support.
A more significant breakdown would be seen if the prices were to close below the 21-day moving average, which is currently at 3483 but is on the rise. Whether Nifty would come down now or continue making new highs, that only Nifty can decide. We as market watchers, can just wait and watch.
Read the Full Post Here

Thursday, September 28, 2006
First signs of weakness???
Posted by
 0
comments
((•)) Hear this post
0
comments
((•)) Hear this post
![]()
![]()
Why this blog spot??
I thought of this blog spot when one of my friends sent me a mail asking me to check out his blog spot. And there it struck me - why not have my own blog spot where I can post mails advising my clients, friends and well-wishers on the latest in the stock market.
Well, the same purpose could have been served with a group mailing system too but what if I wanted to show you some charts? Why should I be the one responsible for cluttering up your mailbox? Well, here it can be easily done.
And moreover, not only can you read what I post, you can give me feedback too and even post your own comments. So, let's just start blogging.
Read the Full Post Here
Posted by
0
comments
((•)) Hear this post
![]()
![]()


