Friday, February 29, 2008

Budget Highlights

Income Tax
The Finance Minister, Mr. P Chidambaram, made the following changes to the personal income tax structure in his budget speech today:
  1. Personal Income Tax Exemption limit hiked to Rs.1.5 lakhs (earlier Rs.1.1 lakhs) for all assessees, Rs.1.8 lakhs for women (earlier Rs.1.45 lakhs) and Rs.2.25 Lakhs for senior citizens (earlier Rs.1.85 lakhs).
  2. Income between Rs.1.5 lakhs to 3 lakhs to be taxed at 10%
  3. Between 3 lakhs and 5 lakhs to be taxed at 20%
  4. Above 5 lakhs to be taxed at 30%

Surcharge ( @ 10%) on an income above Rs.10 lakhs, Education Cess (@ 2%) and Secondary and Higher Education Cess (@ 1%) remain unchanged. An additional deduction of upto Rs.15000/- has been introduced under section 80D for an individual who pays medical insurance premium for his/her parents.

Short Term Capital Gains

Short term capital gains (in case of shares, gains resulting from sale of shares which are sold within 12 months from the date of purchase), which was earlier taxed at 10% will now be taxed at 15%. Long term capital gains remain exempt from tax.
Other Taxes
  1. Dividend Distribution Tax, which the market was expecting to be reduced to 12.5%, remains at 15%
  2. Surcharge on corporate tax, which the market was expecting to be reduced to 5%, remains at 10%
  3. Securities Transaction Tax (STT), which the market was expecting to be increased, remained the same. It will now be treated as a deductible expenditure against business income.
  4. STT on options, which was earlier levied on the sum of the strike price and the premium and was borne by the seller, will now be levied only on the premium amount and will be borne by the seller (if it remains unexercised). However, if the option is exercised, the STT will be levied on the settlement price and will be borne by the buyer.
  5. Commodities Transaction Tax will be levied on commodity futures on the same lines as STT
  6. Banking Cash Transaction Tax (BCTT) will be abolished with effect from 1 April 2009.

Service Tax

Four new services have been added to the tax net. However, the threshold limit of exemption of service tax for small service providers has been increased from Rs.8 lakhs to Rs.10 lakhs. As a result 65000 small service providers go out of the tax net.

Other Major Highlights

  1. For marginal farmers (i.e., holding upto 1 hectare) and small farmers (1-2 hectare), there will be a complete waiver of all loans that were overdue on December 31, 2007 and which remained unpaid until February 29, 2008.
  2. Government estimates that about three crore small and marginal farmers and about one crore other farmers will benefit from the scheme. The total value of overdue loans being waived is estimated at Rs.50,000 crore and the OTS (One Time Settlement) relief on the overdue loans is estimated at Rs.10,000 crore.
  3. Exchange-traded currency and interest rate futures to be launched.
  4. Requirement of PAN extended to all transactions in the financial market.
  5. Allocation for Defence increased by 10% from Rs.96000 crores to Rs.105600 crores.
  6. Peak rate of customs duty left untouched.
  7. Duty on steel melting scrap and aluminium scrap reduced from 5% to nil.
  8. Customs duty on life saving drugs reduced from 10% to 5% and made totally exempt from excise and countervailing duty.
  9. Duty exempted from specified parts of set top boxes and specified raw materials for use in the IT/electronic hardware industry.
  10. Excise duty on all goods produced in the Pharmaceutical Sector reduced from 16% to 8%.
  11. Excise duty on small cars reduced from 16% to 12% and on hybrid cars from 24% to 14%.
  12. Excise duty on two wheelers and three wheelers reduced from 16% to 12%.
  13. Excise duty on paper, paper board and articles made therefrom reduced from 12% to 8%.
  14. Excise duty on certain varieties of writing, printing and packing paper will be reduced from 12% to 8%.
  15. Anti AIDS drug, Atazanavir, totally exempt from excise duty.
  16. Refrigeration equipment (consisting of compressor, condenser units, evaporator etc) above 2 TR (tonne refrigeration) utilising power of 50 KW and above exempt from excise duty.
  17. Excise duty on packaged software increased from 8% to 12%.
  18. Five year tax holiday to encourage hospitals to be set up anywhere in India, especially in tier-2 and tier-3 towns in order to serve the rural hinterland. This window will be open for the period April 1, 2008 to March 31, 2013, during which the hospital must commence operations.
  19. A five year holiday from income tax to two, three or four star hotels that are established in specified districts which have UNESCO-declared 'World Heritage Sites'. The hotel should be constructed and start functioning during the period April 1, 2008 to March 31, 2013.
  20. Central Sales Tax to be reduced from 3% to 2% with effect from April 1, 2008.

Read the Full Post Here

Thursday, February 28, 2008

Budget Day to be Volatile

Shown below is the 60 minutes chart of the Nifty. It wasn’t such a volatile day as we expected it to be. On the contrary, it was a narrow range day with an intra-day movement of only 75 points. More surprisingly, the Nifty is still holding on to our support line mentioned yesterday. Not only that, it even showed a good rally in the last 30 minutes to close near 5300.

A narrow range day suggests that a big move is about to come. This may, or may not, come tomorrow, but will surely come. The more the narrow range days, the bigger the move is likely to be. But for now, we hold our view mentioned earlier that the Nifty is in a short term uptrend (as long as we remain above 5055) and in an intermediate term downtrend (till we remain below 5600) and in a long term uptrend (if 4000 is not broken on the downside). Our view also remains that the Nifty has made a pattern, on its 30 and 60 minutes chart, the target for which is between 5880 and 5900. This will not come in a single rally. There will be minor corrections in between. Traders should continue to follow the short term trend and investors should follow the long term trend, both of which happen to be up now.

Tomorrow is budget day. There may be volatile movements as Mr. Chidambaram continues with his speech. After the speech finishes the markets may go down. This is because the markets have built up expectations before the budget and not all expectations are always met. But, since the markets are already not expecting anything much out of the budget (and a populist budget, as expected, has already been built into the market), there may be some positive surprises in store.

But, we are safe. The traders are already out of the market and are advised to stay away for one more day. A rally above 5300 should be used to build up long positions (in the short term). For long term investors any dip tomorrow, or in the days to come, should be used to buy. Since expectations are already low, there can be nothing worse which can make the markets go down below our intermediate term supports (at 4600).

As mentioned in earlier newsletters, we are inviting our esteemed readers to send in their contributions in the form of articles to be published on this page. Take this opportunity to voice your opinions to the world about the budget, the markets or anything remotely connected to the markets. Please e-mail your articles and don’t forget to mention your name and location so that you are given due credit for the article that is published.

Happy investing!!!

Read the Full Post Here

Wednesday, February 27, 2008

Volatile Markets Expected

Today the Nifty broke through our trendline (shown in the chart below) in the first 30 minutes itself and since then it was a steady decline for the Nifty, though it became a lot steeper in the last two hours. Once a trendline is broken, doesn’t matter which side it breaks out on, a pullback is always expected. This seems to be a pullback to the baseline, though the sharp decline in the last 2 hours says otherwise. Well, we have to follow the market. If we go against it, we will end up in a loss. So, we will wait to see what the Nifty decides to do. For now, since the trendline has not been broken on the downside, we will assume this fall to be a pullback only and we shall assume that we remain in a short term uptrend. We shall be proved wrong if the Nifty were to go below 5250. The positive thing in the chart is that there was a positive divergence between the price and the RSI (price coming down but RSI going up) visible (marked by the brown lines and blue arrows) and it suggests that the trend should reverse if a trendline is broken. That trendline was broken today so we would expect the trend to reverse now. But, as mentioned, the markets are supreme. We have no choice but to follow them.

Depending on how the US markets behave tonight and how the Asian markets open tomorrow; our markets will take a cue from them. Weak US and Asian markets will make our markets open weak but in an hour or so, we could be back focusing on our own markets rather than getting worried about other world markets.

Tomorrow is the last Thursday of the month, which means it is the F&O expiry date tomorrow. This means there will be extra volatility in the markets and it is better to stay away from them. Markets may remain choppy tomorrow. On Friday, we have the budget, another high volatility day. A clear trend will be visible in the markets only in the first week of March. Till then stay away.

Day traders may like to take advantage of the extra volatility. But keep close stop losses because if one gets caught on the wrong side of the market, it could be extremely dangerous because of the high volatility in the markets.

No stocks will be discussed today and tomorrow. Look forward to Monday’s newsletter.

Happy investing!!! Read the Full Post Here

Tuesday, February 26, 2008

Nifty Remains Range Bound

Today was a very boring day for Nifty traders. The Nifty opened at 5200 and soon shot up to 5250. Thereafter, it was just 30 points up and 30 points down from there. In the last 30 minutes, it went up to 5280 but then lost all its gains and finally ended the day at 5249. As seen on this 30 minutes chart, the Nifty now is at a very crucial resistance line at 5280-5290. Once it goes above 5300, we should be looking at a target of somewhere near 5900. That will, surely, bring us back into an intermediate/medium term uptrend.


Jindal Stainless is showing some support near 145 and is now near its short term resistance line. On a breach of this resistance at 161, it is showing a target of between 188 and 189, on its daily charts. This is a short term trade and we should be able to achieve this target in 15-20 days. The reader can keep a stop of 145 as long as she is in the trade. Of course, after such a major breakdown, it could go well above its target and it may, I repeat, may make sense to continue holding on to it. But once a trader/investor enters a trade, she should always have an exit strategy in mind. The exit strategy should always be that the trade is to be closed, no matter what, when the target level or the stop loss level is hit. But if a stock is still looking strong near its target, then one should modify the exit strategy a little bit. Modifying a strategy DOES NOT mean changing the target price altogether. You can modify it in such a way that you close only 50% of your position near that target.

Omaxe has been in a contracting range for more than a month now. Now it has reached a point where it has to break out of the range, either upwards or downwards. The direction is unknown yet. The range, at this point, is between 252 and 269. Whichever direction it breaks out towards, the other level could be used as a stop loss. The target, if it breaks upwards is near 390 and the downside target is near 135. For a stock which has already corrected 68%, it is unlikely that it will lose another 40% from here. So, the chances of it going up are more than it coming down. So, one can buy above 270 with a stop loss of 250 for a target of 385-390.

Attached above is the daily chart of Sterlite Industries which shows that it is now near its resistance line. A positive for this stock is that the RSI has broken through its months long trendline for the first time. A breach of this trendline could take the stock up to a level of near 1000. One should consider buying it above 860 with a stop loss of 755.

There are some other stocks also showing good strength like Divis Labs, Ranbaxy, Infosys, TCS, GMR Infrastructure, Hindalco but they have already been discussed in our earlier newsletters.

Happy investing!!!
Read the Full Post Here

Monday, February 25, 2008

Many Blue Chips Showing Strength

Looking at the last 7 days chart of the Nifty on this daily chart, we find that there is one blue candle, one red candle, one blue, one red and so on. This, along with the narrow range trading, indicates confusion and indecisiveness in the market. The green line just below today’s candle is the 200-day moving average of the Nifty. A close below that would be dangerous. Fortunately, it recovered before it reached there and closed the day about 80 points in the green. While the Nifty is expected to remain in this broad range of 4800-5500, there is support at the 200 day MA at 5030 and resistance, near the previous pivot high formed last week, at 5368.

On the daily chart of Larsen & Toubro, the stock has made a higher low yesterday and is now near its resistance line. With a stop loss of 3385, it seems to be a good buy if it crosses 3520 and it looks good for a target near 4000. Notice the RSI also turning back upwards after touching 40.

Ranbaxy was recommended in the newsletter of 22nd Feb. Unfortunately, on that day because of weak markets it didn’t cross our recommended level of 425. Today again it has knocked against its resistance line. The levels, now too, remain the same. Buy above 425 for a target of 500. However, we have now modified the stop loss from 340 to 390.

Look at this daily chart of Reliance Communications. Two doji days (days having open and close at almost the same level) now with today’s doji with a long lower shadow should be a good bet. Also notice the positive divergence (price going down but RSI going up) between the price and the RSI. Also the RSI fails to breach the 40 level this time around. All these are positives for the stock. Look to buy above 600 with a stop loss of 550 for target prices of around 700 and then 800.

This is the daily chart of State Bank of India. The trendline seen on this chart has been drawn from the lows made in April 2007 at a level of 915. It has been 10 months now and the stock is still finding support near this line. Touching of the trendline today and a doji day with long lower shadows with RSI above 40 are positives for this public sector bank. One could buy it above today’s high of 2140 for a target near 2600. There may be some resistance near 2280 so be careful around those levels. Keep a stop loss of 2050 for this purpose.

We again have a chart with a trendline drawn from the lows formed in April 2007 (of course, that time it had a face value of Rs.10/- as compared to the Rs.2/- now). The price of Suzlon Energy today touched this trendline and is currently trading below its 200 day moving average at 319, with today being the 4th consecutive close below it. Stay away from it for the time being. All long positions should be closed on a close below 290.

Happy investing!!!

Read the Full Post Here

Sunday, February 24, 2008

Penny Wise, Pound Foolish

Conventional wisdom suggests that when the markets have a correction and a dip, one should invest for the long term to take advantage of low valuations resulting from the correction in prices. This is a time tested policy and has stood a lot of investors in good stead.

However, those of you, who have been following the market closely, particularly over the past few weeks, will agree that the markets are passing through an uncertain phase with the market trading in a very wide range of Nifty fluctuating between 4600 and 5500. With the US markets showing no indications of an improvement in the near term, it can be safely assumed that we shall also pass through an extended phase of uncertainty where the Nifty may continue to fluctuate in this wide range for many weeks, if not months. A very wide range of 900 points on the Nifty gives an opportunity to us to take advantage of this situation.

If the above is believed to be true, I would stick my neck out to suggest that even Investors, those who buy stocks with a long term horizon, should change their investment strategy, in the near term at least, and take advantage of the volatility in the market. I would recommend that the strategy ought to be to ‘buy a dip and sell a rally’. That is, one should look for opportunities for making a quick entry, and a quicker exit once you make a profit. Investors ought to buy market leaders whenever there is a dip and rather than get ‘married’ to the stock, look forward to booking their gains whenever there is a rally and then wait patiently for a dip again to reinvest. Before doing this, you should put in some effort to find the range for each of the shares you wish to invest in to time your entries and exits correctly. For the readers who find it difficult to determine this range, we shall be most willing to help them out. So feel free to send us your queries. Why I am suggesting purchase of market leaders is because whenever the sentiment changes for the better, and it surely will do so eventually, it is these large cap market leaders which will be the first to rally. I am quite sure that most investors will be able to get opportunities to book profits in this way at least a couple of times, if not more, before the market finds a trend for itself. This will lead to a reduction in the long term cost of holding for these shares,

What can go wrong with this strategy? The market may not come down after we have sold our stock and we lose an opportunity to get much larger gains that we can expect if we buy and hold for a long period of time. Yes, it certainly can happen. We should keep a close watch on the short term and intermediate term trends and the moment both of them come in sync with the Primary ( Long term ) trend, which is up, one must buy, whatever you wish to, for the long term. At least I am quite confident that we should be able to get two three occasions to book our profits by behaving like a trader before the three trends start moving in the same direction. This policy will also protect you from losses should the primary trend also turn bearish in future. And, of course, when you start behaving like a trader you must have your stop losses and exit plans in situ to avoid unpleasant situations.

Did I hear somebody say that the policy I am recommending is being “penny wise and pound foolish?” Well today’s piece is written specifically with such skeptics in mind.

Contributed by Col. Mahesh Sharma Read the Full Post Here

Saturday, February 23, 2008

Effects of US Recession on India

In Monday’s newsletter, we had attached a chart showing the performance of the Nifty with respect to other major world indices, which showed that the Nifty has outperformed all other major world markets in the past and is likely to do so in the future. That was the technical view-point of why the FIIs should invest in India.

Today, in this newseletter, we will discuss the fundamental factors of why it should come to India. With the events of the last few months, it has been more than evident that the largest, if not the strongest, economy in the world, i.e. that of the United States is heading towards a recession. But how does one say that? The answer is the GDP (Gross Domestic Product). A GDP, in simple terms, is used to gauge the health of an economy. Let us compare India’s GDP with the other world economies. According to 2007 data, measured at $796.1 billion, India’s economy is the tenth largest economy in the world. United States has the largest economy with a size of $13.22 trillion. The other countries between the US and the India in decreasing order of size are Japan, Germany, China, UK, France, Italy, Canada and Spain. Now let us look at the GDP growth rates. Again, according to 2007 data, India stands at number 17 with a growth rate of 8.5%, China stands at number 9 with a growth of 10.5%. Azerbaijan has shown the maximum growth of 32.5% in 2007 but has a size of only $14.05 billion. Out of the top ten countries by size the third country, after China and India, is Spain showing a growth of only 3.6%. United States stands at number 63 with a growth of only 3.4%.

You may ask – so what? Just because India is now showing 8.5% growth does not mean that it will be the same in the years to come. Well, you may be right. It may fall down. The signals are already there. But to what level and because of what reasons? Lets consider the various components of GDP. In layman’s language, GDP is the sum of the total consumption, investments, government spending and net exports. Let us look at each one of them in detail.

Consumption is the sum of expenditures by households on durable goods, non-durable goods, and services. Investment is the sum of expenditures on capital equipment, inventories, and structures. Government spending is the sum of expenditures by all government bodies on goods, services and infrastructure. And Net export is the difference between total exports and total imports.

Now that we know the components of a GDP, simple logic tells us that the GDP would go down only if either consumer spending, or companies’ investments, or government spending or exports, or all of them, go down or if the imports go up. Now let us look at the demographics of India. According to a survey
done recently, about 65% of the population is between the age of 15-64. Another source also says that the working population of India is expected to remain between 60-65% till 2050 as compared to the ageing population of the western world. A higher percentage of working population means increased demands, which means increased production, which means increase in the number of jobs, which means increased salaries, which means increase in disposable income and which means increase in consumer spending. This explains that both the consumer spending and investments are set to increase in the years to come. With increase in salaries and increase in spending, it would mean increase in tax collections which would, in turn, be spent towards developing the country’s infrastructure. And with the Commonwealth Games approaching in 2010, infrastructure is now set to increase at a much faster pace than usual.
The only concern is that with recession in the US, will it affect our exports? If the exports do go down, it will have a negative impact on the GDP. But how much would a recession in US affect us? Our main concern right now is that it will affect us because in this world of international trade, we are dependent on the US also for our exports and a recession there could lead them to cut their imports and hence our exports. But how much are we really dependent on them?

For that we have to see the export figures to US. In the year 2006-07, our exports of goods were roughly 14% of our GDP while total exports of goods and services stood at 27% of the GDP. Out of the 14% (of GDP) worth of goods exported by India, 14.9% (of total exports) was exports to US, which, in turn, means that as far as export of goods is concerned, only 2.09% of our GDP is dependent on them. If 27% is total exports out of which 14% is for goods that means 13% of services were exported. Unfortunately, countrywise export data of services is not available but we do know that out of a total export figure of $119 billion, $54.6 billion (45.88%) accounted for export of software and BPO services. Since the major exports of services to US is in the form of software and BPO only, it means that exports of services to US accounts for roughly 6% (45.88% of 13%) of our GDP. So, our total exports to US is only about 8% of our GDP. Now, how does a recession in US affect us? If they are in a recession, will they stop all their imports? Obviously not. They would, at the most, reduce it to save their spendings. To reduce their costs, they may cut down on imports of manufactured goods. Another way of reducing their spendings would be to outsource some of their jobs. Since both China and India specialize in providing skilled labour at cheaper rates than America, and since India is an English speaking country, most of those outsourcing jobs should come to India. So, while the US imports of goods may go down, the import of services may actually increase. Even if they reduce their imports of goods from India by a hefty 25%, it would still affect our GDP by only between 1 and 2%. This means that the growth rate of our GDP would still be much much higher than the top ten countries of the world (except China).

The above facts coupled with the interest rate differential between India and the US leave no choice with the FIIs than to invest in India.
Read the Full Post Here

Friday, February 22, 2008

Pharma and IT Sector Good to Invest Into

The Nifty opened on a positive note today, found resistance immediately near 5240, came down in the mid afternoon session to reach yesterday’s lows of 5120 and in late trade again showed a good recovery to close at a level of 5210.
What we are seeing here is a 30-minutes chart of Nifty along with its RSI (Relative Strength Index) at the bottom. This chart has been shown with a number of trendlines, arrows and numbers. Try not to get confused with so many of them. If you want, you can right click on the chart with your mouse and select – “open link in new window”. That will open the chart as a larger image in a new window and toggle between the two windows to read in one window and to see the chart in the second. Let us look at the most recent set of arrows and trendlines (marked by 1). In this you can see that the price has made a bottom at the same level as yesterday whereas, correspondingly, the RSI has made a higher bottom. This is known as a bullish divergence or a positive divergence. This gives an early indication that the downtrend may soon be over. The actual confirmation comes when the price breaks the trendline, which it did in the last 30 minutes. This suggests that we should see the price going up tomorrow onwards. How long this new uptrend will last, only time will tell.

Let us go a little earlier in the chart, say the period between 14th and 19th Feb (marked by 2). We can see in this that the price continued to make higher bottoms while the RSI, at the same time, continued to make newer lows. This is known as a bearish divergence or a negative divergence between the price and the RSI. This means that this uptrend may soon be broken but a confirmation will come only when the price breaks the trendline. So even though the divergence came on 15th and 18th but it was not confirmed until late in the afternoon on 19th. Going a little earlier in the chart between 11th and 13th, another bullish divergence is visible at the place marked 3.

A technical analyst should realize that visibility of a divergence is not a signal to buy or sell, it is only an indication that the trend may change. A divergence has the same relationship with price that dark clouds have with rain. Visibility of dark clouds is only an indication that rain will come but it is not certain that it will rain till it actually does rain. For all one knows, the dark clouds may be blown away by the wind before it rains. Similarly, a divergence is an indication that the trend may change but till the price actually breaches a trendline, there is no certainty that it will. Divergences also do get ‘blown away’ occasionally. Fortunately, today it has made it certain that we may see a new uptrend now. But, since we are looking at 30 minutes charts, the trend may last for a very short period of time.
Divis Labs is also showing a bullish divergence with the RSI on its daily charts. But a confirmation from the price is yet to come. One could consider buying Divis Labs above 1450 with a stop loss of 1310 for a target of near 1650.
GMR Infrastructure seems to have broken through its resistance line while the RSI has been making tops at virtually the same levels. This seems to be a good time to buy the stock of this infrastructure company. One may look to buy above 185 with a stop loss of 164 for a target of 220.
Hindalco Industries has broken out of a W pattern (alos commonly known as a double bottom pattern, apparently, with low volumes. But these low volumes could also be attributed to the weak sentiments in the markets. Buying above 191 with a stop loss of 174 may give us a target near 220.
Infosys Technologies, and all other software services stocks have shown some good recovery in the last few days, which could be attributed to the fact, that the rupee has gone down versus the dollar. Infosys is still looking good on the charts. It seems to have broken out of a downtrending pattern and looks all set to go up. A noticeable fact is the, not so encouraging, volumes. But, a trade can be taken because of the low (comparatively) risk-reward ratio. Buy above 1650 with a stop loss below 1470 for a target near 2000.

Ranbaxy is also showing a bullish pattern. We have already mentioned Divis Labs in this newsletter which is looking good to buy. Other pharma stocks like Aurobindo Pharma and Dr. Reddy are also showing strength but because no particular buy signal has come in them, therefore, they are not discussed here. This suggests that the whole pharma pack is looking strong. The thing to consider here is that since the whole sector is looking attractive, hence buy signals in this sector may be more reliable than the others. Ranbaxy, if it is able to cross 425 is looking very attractive and is showing a target of around 500. The only negative in this pharma giant is that it has a very wide stop, at least at the moment it does. The stop loss is at 340 right now but if the price were to cross 450, we could increase the stop to 415-420. But, be sure that you buy only if it were to go above 425.

Steel Authority of India (SAIL) is very close to its resistance line. It may find resistance here, or it may breach the resistance. If it does breach it, then it should be a good opportunity to buy. One may buy it if it goes above 240 for a target of 290. This also has a problem of a wide stop of 180, to start with, but risk averse investors may keep a stop below 219 to protect heavy losses. Indications are that it should be able to breach its resistance this time. Yet, the reader has to ensure that she buys it only when it crosses 240. Ignore all price movements in the first 30 minutes.

I’ve never seen a more interesting chart than this. Sasken Communication Technologies. Notice the decline with very low volumes in mid December and mid January. Notice the volumes now. Notice the series of doji candles (doji candles are those candles having the open and close at the same level) in the last 10 days. What does it indicate? Accumulation? Distribution? It is down 70% from its top and still showing dojis? There is something serious going on in this stock. I would say that, at the risk of putting my foot in my mouth, it is a wonderful stock to buy at current levels. The stop loss, technically, is below 119 but one can keep a wider stop also to suit one’s risk appetite. Worth a mention here is that like Infosys, even Satyam Computers, Tata Consultancy and Wipro are also looking good, though they are not discussed in this edition of the newsletter. Due to space and time constraints, they are not discussed today but one can pick them up at current levels and we will discuss them tomorrow.

Happy investing!!!
Read the Full Post Here

Thursday, February 21, 2008

Consolidation to Continue

For over a month now, the Nifty has been consolidating within this range of 4800-5500. Till the Nifty moves out of this range, a clear trend will be difficult to predict. But it has already been predicted that after such a heavy downfall, a long consolidation was to be expected. After today’s downward move, it can be observed that the Nifty has made a lower high as against the previous high that it made in the beginning of the month. The Nifty has three supports visible on its daily charts. The first one is the support around 5100 levels, where it has found support on 5 occasions within this range itself. The next is the support provided by the 200 day moving average at 5015, which happens to be quite a strong support. And last, but not the least, is the support at the lower end of the range between 4800-4900. On the upperside, resistance lies between 5400 and 5500. It is noticeable that the Nifty has again turned down after a doji day.

Shown above is the relative performance of the top 9 indices of the world starting from August last year. The topmost line in green is that of Nifty and the bottommost line is that of Nikkei. Dow Jones is the black line, which is somewhere in the middle position. It is clear from the chart that despite the heavy correction, it is clear that only the Nifty and the Hang Seng have been clear outperformers as compared to the rest of the world. I have seen the chart on various time frames and have seen that in any chart longer than a 3 month period, the Nifty has been an outperformer. This chart is also available to FIIs all over the world. Not only this, they have better research available which shows that the Nifty has been, and will be, an outperformer as compared to the rest of the world. Imagine, when the sentiment improves, and if you were supposed to invest your money, where would you invest it? Thank you, your answer says it all.
Happy investing!!! Read the Full Post Here

Wednesday, February 20, 2008

Uniform Face Values - Will They Be a Reality Soon?

I am out of the office for a few days, which is why for this week I will not be able to post newsletters based on technicals. But I have requested my colleagues in the office to post some interesting stuff on the site so that the readers/regular visitors to my site don't go away disappointed. Not only my colleagues, any of my readers who would like their views/opinions/articles published on this site, I would request them to send an email to me and I will do the needful. But do not forget to add your name and email ID in your email so that you get 'due credit' for your article. Today's article has been sent in to me by Parul. She has collected some fundamental data and has posted her view on them. Please go through them.

Uniform Face Values???

The face value of shares of all listed companies may soon be Re .1/- if the SEBI board accepts a proposal by the Primary markets Advisory committee or the PMAC. The move aims to ensure uniform face values, so that investors can make informed stock comparisons. It could well be the first major policy decision that CB Bhave, the new SEBI Chairman, has to make, something that could change the way the Indian capital markets operate.

Sources say the proposal, if it gets through, will mean that companies that have a face value of more than Re.1/- will have to go in for a stock split. The aim of this move is to ensure uniform face values so that investors can make informed stock comparisons. The move could also result in greater public float of listed companies.

Sources in the PMAC said the ultimate aim is to do away with the face value concept. Stock exchanges abroad do not have the concept of face value, so any fresh listing does not carry either a premium or a discount with it. The PMAC wants SEBI to benchmark its policies to this international best practice. The other important fallout will be that the public float of stocks will go up, something the government has always wanted, though the market capitalization will remain the same.

Punj Lloyd - A Fundamental View

Punj Lloyd Limited (PLL), wholly owned subsidiary of Sembawang Engineers & Constructors Pte. Ltd. (SEC), has bagged a Rs.11.2 billion order from Marina Bay Sands Pte. Ltd. The current order win demonstrates the engineering prowess. In the past, SEC margins were low on account of legacy orders that had margins of around 1-1.5%. This impacted the PLL group i.e. PLL + SEC margins, which fell from 11.2% in FY2006 to 7.6% in FY2007. New order inflows will be positive for the group as rising share of new orders in SEC order backlog will help alleviate SEC margins. PLL’s consolidated EBIDTA (Earnings Before Interest, Depreciation, Taxes and Amortization) margins should also improve to 9.8% in FY2009E against 7.6% in FY2007.

At the Current Market Price (CMP) of Rs 367/-, the stock is trading at a PE Ratio (PER) of 17.7x FY2010E earnings and 8.8x FY2010E EV/EBITDA (EV=Enterprise Value). The core business is valued by average of price targets derived from PER of 25X FY2010E, EV/EBIDTA of 14X FY2010E and 3 Stage DCF(Discounted Cash Flow) Model with terminal growth rate of 4.0% and discount rate of 11.0%. The core business is valued at Rs 176.3 billion or Rs.549/- per share of PLL. New business like ship building, real estate and medicity project is valued at Rs.17.3 billion or Rs 54/- per share of PLL. This gives us a combined value of approximately Rs.600/- per share.

Maruti Suzuki Limited - Losing Ground?

Fundamentally, Maruti Suzuki is a great buy at these levels. All the talk about the company losing ground in wake of the launch of Tata Nano is just inaccurate. If you look at the sales figures of the cheapest car available in the Indian market today, the Maruti 800, the figures show a steady decline in numbers versus the steady rise in sales figures of the Alto and other models. Therefore, people choose not to buy the cheapest car but one that offers good features too. The sales of Tata Nano will only cut into the sales growth of higher priced motorcycles and to some extent that of Maruti 800 only. Maruti Suzuki will continue to outperform in the auto sector with the impending launch of its new models over the next year - not the least is the launch of the Swift platform based replacement for the Esteem. So one should just go ahead and accumulate on every fall - the valuation is very very attractive. Outlook on passenger vehicle segment looks positive fundamentally. With stronger macro economic indicators like GDP growth rate ranging between 7-8% annually, with rising income levels, more product choices being made available to customers by car manufacturers is expected to lead to a healthy domestic offtake of cars, wherein growth rates are likely to be around 13-15% CAGR for the next 3-4 years. But in the short to medium term, expect car manufacturers to face the hit of rising interest rates, whichwould impact the sales volume. The company should be able to retain its leadership in passenger cars market, if not increase, with its strong leadership position in compact car segment which accounts for 70% of overall car market size.

Indian market is expected to remain centered around compact cars due to poor roads, heavy traffic, high petrol prices and affordability issues for at least next three years. Factors like rising consumerism, favorable demographics, affordable financing, excise duty cuts (in the earlier Budget) coupled with wide-spread dealer network, superior customer rating and aggressive marketing with continuous new product launches will strengthen Maruti's position further in domestic car market. At present, the stock looks attractive at 10.5x FY09E & 8.6x FY10E earnings, 6.3x EV/ EBDITA FY09E & 5.1x EV/EBDITA FY10E and 1.1x FY09E MCap/Sales & 0.8x FY10E MCap/Sales. Buy Maruti with target price of Rs 1250 in the long term.

Contributed by: Parul
Read the Full Post Here

Monday, February 18, 2008

Volatility Likely to Continue

The markets continue to be choppy and volatile. Such a situation can continue for weeks. The short term trend has changed to Up. The intermediate trend is Down. The primary or long term trend continues to be Up. In such a scenario of extreme volatility, we have to change our strategies. Even Investors have to behave like Traders.

The strategy clearly has to be to buy on a dip and book your profits on a rally and also follow stop losses. The average historical volatility for Nifty is 30%. Presently it is 60%, almost double its long term average. Since the markets are volatile, the stop losses have to be kept sensibly. Small stop losses are likely to trigger easily. As long as the volatility remains high, one must keep the volumes low to keep a control over losses.

Bonus in Reliance Power
Reliance Power is going to have a meeting on 24 Feb to consider issue of free bonus shares to all shareholders other than promoters. The company had come with an IPO in Jan 2008 wherein it issued shares to Retail investors at Rs.430/- and to QIBs at Rs.450/- per share. The shares were listed in NSE and BSE on 11 Feb and have not seen the price of Rs.450/- ever since. Having created a record by being over-subscribed 72 times the price, after listing it has seen a low of Rs.333 on 13 Feb. The management of the company claims that it is taking this step to look after the interest of its share holders and to compensate them for the short term loss incurred by them.

In actual fact, this is just a ploy to reduce the IPO price, which had been set very aggressively at the time of issue. In a way, it is an admission by the company that the IPO was grossly overpriced. It is being done only to win back the favour of retail public as the ADA Group has plans to raise capital in at least three issues during the year. An adverse public reaction is likely to damage the prospects of the Group raising the requisite capital.

The investors, at large, should learn a lesson from all that has transpired in the Primary market during the past few months that they should not take their investment decisions based on the market hype or the so called ‘grey market premium’, which in any case is, manipulated by the vested interests. The public must understand that the bonus issue does not, in any way, change the market capitalization of the company.
Col. (Retd.) Mahesh Sharma
Read the Full Post Here

Sunday, February 17, 2008

Base Building 'On' in Most Stocks

The Nifty, on Friday, remained a little range bound in the first half of the day but after noon, once it was able to cross the day’s highs, it consistently went up. The Nifty now has reasonable resistance at 5350 levels, still about 60 points away from Nifty’s close.
On the way up the Nifty managed to break its resistance level (marked by the blue line) and signified that it was no longer in a downtrend. Not only that, the pattern formed on this 30-minutes chart before the breakout tells us that the target for the Nifty could now be 5750. But there is another very important thing visible here. And that is the presence of the two dojis (open and close near the same price) at the end of the chart (in the red circle). It has been explained in earlier newsletters that dojis represent uncertainty and that they are formed, generally, near short term market tops/market bottoms. If this were to be true, we could see the Nifty coming down tomorrow. Fortunately, support is not too far away and should find support near the blue line, i.e. between 5200-5210.
Balrampur Chini is currently in a base-building phase and once it breaks through the upper trendline, it should be a good time to buy. Unfortunately, in such kind of patterns, the risk reward ratio is 1:1, which means that the stop loss is as far as the target. But to get rewards, one has to take the risk. So, a buy above 93 with a stop loss of 75 should take us to a target near 112-113.
BHEL has broken through one trendline and is currently facing resistance from another one on its daily chart. But if this resistance is crossed too then it should go up to its next resistance line between 2600-2700. Buy above 2315 with a stop loss of 2050.
Sesa Goa is also making a base on its daily charts after a sharp decline and is now standing at its resistance. It has also broken a downtrending line on the RSI. This resistance line (on the price chart), which means above 3250 could give us a target of around 3700. A stop loss of 2800 seems reasonable at the moment. But the important thing is that will Sesa Goa break through its trendline tomorrow? Maybe, it could, but there are two negatives here which are pointing against it. One is the doji made on the chart on the Friday, which suggests that this could be a short term market top and the other is the reasonably low and declining volumes, which accompanied the price increase in the last 4 days.
Tata Steel is near its 5 month old resistance line on its daily chart and prices going above this trendline could be bullish for this steel stock. One could buy it above 830 with a stop loss at 700 for a target of somewhere close to 970.

Happy investing!!!
Read the Full Post Here

Thursday, February 14, 2008

Short Term Trend Now Up

Today was a good day. Out of the many stocks recommended yesterday, some of them opened with such a huge gap that it made no sense to buy them at such high levels. At least four stocks reached their respective targets (we had recommended small targets of 3% in most of them), and most of the remaining ended the day with a small profit without touching their targets, thus leaving our positions open. Jindal Steel recommended on Monday is already giving us a profit of about 12% from our entry price and has come within scraping distance of our target of 2450 (entry price was 2100) and accordingly, we have increased our stop loss to 2300.

Today is a good day to discuss how to change our trading approach when the market opens with a gap up or gap down. Well, investors shouldn’t bother with gap openings because when one is investing for long term, a few rupees here and there would not make too much of a difference to their returns. For day-traders and swing traders, it definitely will. So, it is these traders who have to modify their strategies. It is best not to change your approach after market opening because that leads us to panic. Rather, make it a rule so that gap openings don’t bother you. If one follows these 10 simple rules, it will save them a lot of tension and ‘high BP’. The rules are as follows:
  1. Before the market opens, you should have pre-decided entry levels, stop losses and targets.
  2. Never enter a trade in the first 30 minutes.
  3. Enter a long position only if the price goes above the high of the previous 30 minutes. If it does not do that, just wait.
  4. Similarly, enter a short position only if the price goes below the low of the previous 30 minutes. If it does not do that, just wait.
  5. If you still haven’t entered the trade, again follow rule number 3 and 4.
  6. If the stop loss or the target is hit before the entry, just forget about the trade. Do not enter at all.
  7. If the difference between the target price and entry price is very low, and it seems that you are taking too much of a risk compared to the reward, do not take the trade.
  8. ALWAYS exit at your target. DO NOT be greedy.
  9. If at all you want to be greedy, at least close 50% of the position and be greedy on the remaining 50%. Modify the stop loss to your purchase price so that you don’t end up with a loss on the remaining 50%.
  10. If you are already in a trade (carried forward trade) and the market opens below your stop loss for the day, immediately close the trade.

Now, lets discuss the Nifty. As seen from the daily chart of Nifty above, there was some hope. The Nifty, which had on three consecutive days closed below the 200 day moving average, today managed to cross it and with quite a margin. This move changes the short term trend to up but the intermediate trend still remains down. The intermediate trend will change to up when the Nifty crosses the brown line (previous high), which happens to be at 5545. Meanwhile, it should also not cross below the previous low of 4800 or its 200 day moving average at 4992. Meanwhile, the Nifty now lies very close to its next resistance at 5260, as shown by the blue line.


Aditya Birla Nuvo seems to have broken out of this downtrending channel on its 30 minutes chart. This may be bullish for the stock. Consider buying above 1800 with a stop loss at 1760 for a target of 1880.


Hindustan Constructions, on its 60 minutes chart has formed an unconfirmed inverted head and shoulders pattern. This pattern would only be confirmed it the price were to go above 175 with high volumes. A good test of volumes would be to compare it with the current volumes. The current volumes, on an average are about 2.5 lakh shares every hour. So, if the volumes are about 4 or 5 lakh shares in an hour’s time, and the price is above 175 then it would be a good time to buy the stock. The stop loss should be set at 150 and 250 should be a reasonable target for this pattern, once it is confirmed.


IDFC has broken through this straight trendline on its 30 minutes chart. This trendline has been tested 6 times in the past 20-25 days (marked by the blue arrows). Only on two occasions has it given a false signal when it was breached without any resistance. It would make sense to buy it above 200 with a stop loss of 193 for a target near its previous recent highs of 215.

Besides these Indiabulls, LIC Housing Finance (above 280), State Bank of India and Welspun Gujarat (above 450) also seem to be good buying opportunities. The charts for these have not been given.


Happy investing!!!


Read the Full Post Here

Wednesday, February 13, 2008

Many Stocks Showing Strength

The IPO page had been added to our site yesterday. Today, the ‘About Us’ page has also been completed. Please have a look at the same by clicking on the links on top of the page. The Futures and Options page should be ready within a couple of weeks.

The Nifty opened on a high today, went up to yesterday’s pivot high of 4983, made quite a prominent pivot high at 4985 and turned down. Support was expected at 4805 but it came down to 4863 and turned from there to close at 4951. Now we have a pivot high at 4985 and a pivot low at 4822 (made yesterday). A decisive breakout out of one of these two levels should give a bigger move. We can safely say that if the Nifty were to go above 4985 and fails to come below 4863 then the short term trend will change to up. Today, in the last 30 minutes it seems to have broken through its downtrending line which was giving resistance near 4925.

Another positive thing noticed today was the Nifty has been trading in a broader range of 4800-5000 for almost 3 days now (30 bars) and has shown some signs of consolidation within these levels. The buy signal given by MACD yesterday (marked by the green arrow) is still intact and hopefully, we should have a bigger move tomorrow. If the price were to go above 5000, it should find resistance near its next trendline between 5150 and 5200. On the downside, if the Nifty were to go below 4800 then a level of 4600 is possible.

A lot of charts today are showing strength on the 30 minutes charts but are not giving any targets as such. Showing the charts of all such stocks is going to take a lot of time. So, without giving any charts and targets as such, I am mentioning some stocks which may be good buying opportunities. And since no clear targets are available (unless otherwise mentioned), it is suggested that one should keep small targets of 2-3% and cover their positions once the target is achieved. A stop loss for each has been given to protect huge losses.

  • 3I Infotech – Buy above 117, stop loss 110
  • ABB – Buy above 1310, stop loss 1250
  • Adlabs Films – Buy above 810, stop loss 750
  • Aftek - Buy above 50, stop loss 47
  • Allahabad Bank - Buy above 108, stop loss 101
  • Ambuja Cement - Buy above 117, stop loss 114
  • Canara Bank – Buy above 300, stop loss 285
  • Cummins - Buy above 330, stop loss 315
  • DLF - Buy above 820, stop loss 790
  • Gail - Buy above 405, stop loss 390
  • HDFC - Buy above 2760, stop loss 2600, target may be near 3000
  • HDFC Bank - Buy above 1480, stop loss 1440, target may be near 1580
  • ICICI Bank - Buy above 1120, stop loss 1060
  • India Infoline - Buy above 1110, stop loss 1040, target may be near 1220
  • ITC - Buy above 200, stop loss 190, target near 213
  • Nicolas Piramal - Buy above 320, stop loss 305, target near 340
  • Reliance Energy - Buy above 1600, stop loss 1500
  • Reliance Capital - Buy above 1850, stop loss 1750
  • Tata Motors - Buy above 720, stop loss 708, target near 750

Happy investing!!!

Read the Full Post Here

Tuesday, February 12, 2008

A Technical Pullback May Be Possible

A new page on IPOs has been added today. There is still very limited content on it but we will keep adding more content on it to keep you up to date with the latest in IPOs. The Indian Markets and World Markets page has some reasonable good data. Go and check out the other pages by clicking on the links above. The Futures & Options Page and About Us page are still under construction. They should be ready in a week or two.

As this newsletter is being written, the European and American markets were trading in the green after the news came out that Warren Buffet’s company, Berkshire Hathaway Inc., has offered to take over the liabilities from bond insurers. At this moment, the Dow is up 213 points, Nasdaq up by 24 points and the FTSE up 202 points. All Indian ADRs except VSNL are in the green as of now.

Coming back to India, the Nifty closed 18 points in the red at 4838. Looking at the 30 minutes chart of the Nifty today, we find that it remained in a very narrow range throughout the day. Buying was seen at lower levels while higher levels encountered selling. We still remain in a short term and intermediate term downtrend. The short term trend will change to up when the Nifty crosses 4950. A pattern of higher highs would be formed if the Nifty were to cross 4983, a pivot high made yesterday. The next important level and a more prominent and significant pivot high is at 5168 (both these levels have been marked by the thin dotted lines on the chart). 4805 is a support level, being the most recent low. If this is broken, we are going to see further weakness.


Yesterday we had shown the daily chart of Nifty along with the MACD indicator. The details of the calculation and construction of this indicator are beyond the scope of this newsletter but as was explained yesterday, we get a buy signal when the green line goes above the red line and a sell when the green line goes below the red line. Today, we have taken the MACD on the 30 minutes chart. Not only that the buy and sell signals have been marked with arrows on the charts and we can see that they were pretty good signals. If one had taken all signals (buy and sell) on the Nifty based on the MACD from 17th Jan till today, one would have made a profit of approximately 1250 points on one unit of Nifty or Rs.62500 on one lot of Nifty (50 units). But that is not we are discussing here. This was just to give you an idea about how effective this indicator can be and this was in a market which has given many whipsaws (signals which resulted in a loss) especially between 24th Jan and 1st Feb. Another important, and the more relevant, thing to note is that the MACD has given a buy signal again today. With the stop loss (4805) only 30 points away now, this trade could easily be taken.

With the world markets remaining as they are, we may not have a negative effect from them tomorrow morning. The Nifty has been coming down since the last 6 trading sessions and it is definitely time for a technical pullback or a bounce now. Taking these factors into consideration, a buy at this level for small profits may not be a very bad idea. If at all, the markets do move against us, the stop loss is very close at hand so this may be a low risk buying opportunity.

Looking at small profits there are a few buying opportunities available. One such stock is Andhra Bank, which seems to have completed its downtrend as its downward sloping trendline has been broken. Narrow range bars in the end with high volumes may signal accumulation. Look to buy above 86.50 with a stop loss of 82.50 for a target near its next resistance near 92.

Similar chart in Alstom Projects (APIL). With a stop loss below 655, it may be bought above 700 for a target near 750.

Jindal Steel also may have completed its downtrend, though, it still hasn’t gone above its trendline. With a stop below 1900, look to buy above 2100 for a target near 2450-2500.

Happy investing!!!
Read the Full Post Here

Monday, February 11, 2008

Still Very 'Gloomy'

The Nifty continues to make lower lows. It was expected to find support near 4900 but it broke through that too. The charts are looking more and more bearish everyday. It closed lower than the close on the ‘Black Tuesday’ last month. Not only that, it also closed below its 200 day moving average, which was giving it support at 4975. One should remember that the 200 day moving average is a very significant level to break. Seeing the chart it is clear that this moving average has been tested on 5 occasions in the last one year but the Nifty has never been able to close below it.

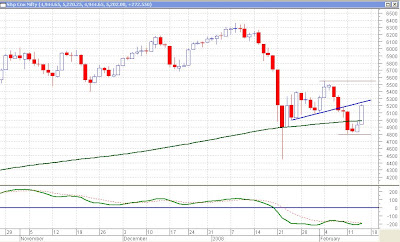
What is a moving average? Till now, I have been using trendlines on my charts in the newsletter and I’m sure all of you would be aware of trendlines and their significance and the supports and resistances provided by them. In simple words, trendlines are sort of an average of prices and it is expected that prices will find support/resistance there. Moving averages are basically moving trendlines and they are actually an average of the closing prices of the price of ‘x’ number of days. Most significant moving averages used by chartists are 5 day moving average (DMA), 10 DMA, 20 DMA, 50 DMA, 100 DMA and 200 DMA depending on the time period one is looking at. It is generally said that the index/stock is bullish above a trendline and bearish below it. Prices below the 200 day moving average are indicative of a bear market. It has been seen in the past that the prices have been able to close below the 200 day moving average but soon cross over again. I would, personally, give the Nifty some time to recover. If it were to stay below this moving average for the next five sessions, then I would have a very negative view on the market . Five consecutive closes below it will be bad for the markets.

At the bottom of the chart today, I have included a new indicator – MACD (Moving Average Convergence Divergence) instead of the RSI. The signal that we get from MACD is that we should buy when the green line crosses above the red line and sell when it comes below it. Even after coming to such extreme levels (it has never come down to such levels in the past one year), it has again given a sell signal. We are probably heading towards our target of 3800-3900. But before that 4530-4550 is a key level to watch. Support there can bring us back in the running for newer highs. For now, it is just wait and watch.

We still are in a long term bull market (if 4500 is not broken) and our strategy in bull markets should be to buy on dips. This is, without an iota of a doubt, a dip. Then why are we scared of buying now? Well, fundamentally, India is still on a high. Among all emerging markets, India is the best placed, demographically, to see a sustained rise in the economy. And if the economy is doing well, nobody can stop the markets from rising. But as suggested earlier, lower levels are possible and one should take the opportunity to buy now, but with a stop loss of 4500.

Happy investing!!! Read the Full Post Here

Sunday, February 10, 2008

'Boom, Doom and Gloom'

We have a new widget added on the world markets page today which gives the latest market prices of Indian ADRs listed on the American Markets. Click on the World Markets link to see. We are adding new content to our other pages every now and then. Please keep visiting them to see what's new. Very soon we are going to have a page on IPOs and on Futures and Options too.

Anyway, back to the markets. It’s all looking gloomy right now. The intermediate trend of the Nifty has been down for the last three weeks now. The short term trend had turned positive for a short period of time but that also has become negative now. The Nifty has now confirmed breakdown from two patterns. One is the
channel breakdown, the one which is represented by the smaller circle or by the two uptrending
blue lines. This was a 450 point wide channel and it broke through the channel at a level of 5170-5180. Considering that the breakdown is also of the same magnitude it gives us a target of 4720-4730. The green lines shown here at 5035 and 4900 are just minor supports inbetween.

The second pattern that we are talking of is much larger and much more ‘horrifying’, to say the least. This pattern is the inverted flag pattern and is shown within the larger circle on the chart. In
this sort of a pattern there is a clear trend in place (could be an uptrend or a
downtrend) and then prices consolidate within a range (which could be a straight or a rising or a falling rectangle or could be a rising or a falling wedge) and then the prices break out of the consolidation and continue the previous trend which was in place. The ‘horrifying’ thing is that such patterns are formed approximately half-way between trends. And if this indeed is half-way then the target for the end of the trend is, hold your breath, 3820.

We have been saying that we are in a long term bull market and that we should be buyers on every dip. The definition of a bull market is that we (rather, the chart) should be making a pattern of higher highs and higher lows. And the converse is true for bear markets. We have three trends which we usually talk about, namely the short term, intermediate and long term trends. Generally, we watch short term trends in the 30-minutes charts, the intermediate trend on daily charts and long term trends on weekly/monthly charts. We are already in a short term and intermediate term downtrend because a pattern of lower highs and lower lows is visible both on half hour charts and on daily
charts. We have a very good support at 4600, which is from an upward
sloping trendline drawn on the weekly charts. The moment this trendline is broken that would be the first signal that a long-term bear market may be approaching. The actual confirmation would come when the previous low (which is at 4002) is broken. That is why we say that till the time 4600 is broken, we should remain buyers on dips.

But this may call for a change of strategy now. We are predicting the target for the flag pattern to be near 3820 which is well below both 4600 and 4002. If this target is achieved, we would no longer be in a long term bull market. That is why, we should now modify our strategy. Our strategy should be that
“I am in a long term bull market which is true as long as Nifty is above 4600. I will assume that the long term bull market will continue to be a buyer on dips, but with a stop loss of 4600.”

We should not take any positions against the trend, which is why we are not talking of any buying opportunities right now. Life is full of ups and downs and so are the markets. Like in life, markets also see successes and failures (of patterns). Patterns do fail occasionally and this is one occasion where we would like it to fail. We would define failure of this pattern as a failure if (a) it fails to reach its target or (b) if it crosses 5650 on the upperside or (c) it comes back in the range of 5200-5650, in which case we can again wait for a pattern breakout/breakdown. As much as we may hope for a failure, one should be cautious as hopes rarely turn into reality in the markets. And the markets have their own minds. It may decide to go where we expect it to go (3820) or it may still decide to convert our hope into reality. Let's see what the market decides to do.

Your comments on this post are most welcome. Please click on the comments link below to post a comment.

Happy investing!!!


The following article has been written by Col. Mahesh Sharma of Surakshit Securities who shares his view on the markets.

IS IT REALLY ALL DOOM AND GLOOM???

All markets, particularly the Stock Markets, run on sentiments. In the middle of January this year history was made when the largest ever IPO by an Indian company (Reliance Power) was fully subscribed in less than a minute. By the time the issue closed it had been oversubscribed 70 times, which itself is a record for an issue of this magnitude. Yet, just three weeks after that we have had two IPOs, including Emaar MGF, which had been floated by a large Gulf based developer in collaboration with an Indian company, being withdrawn from the market. Such is the effect of sentiments in the market.

When the sentiment is good markets tend to ignore bad news and when the sentiment turns negative even the good news is overlooked. In today’s newsletter, we have seen the technical view of a chartist. Markets have a habit of over-reacting. In a positive sentiment there is irrational exuberance and we look for means to justify the extended valuations by discounting cash flows of future years and talk of embedded values getting unlocked. And when the sentiment turns negative we have a scenario of excessive pessimism with analysts calling it ‘doom and gloom’. The reality lies somewhere in between these two. And sooner, rather than later, the market will revert to the mean.

Let us take a rational view of what is happening today. Between 18 Jan, when there was almost a mad reaction of over 10 lakhs new demat accounts opened in a few days so that people could apply for Reliance Power IPO, and last week, when there were no takers for the IPOs of Wockhardt Hospitals and Emaar MGF, all that has changed is the sentiment. Yes, the market has lost nearly 1300 points on the Nifty, but, has there been any change in the fundamentals of the market?

We have, perhaps, a little more clarity of the American economy and it is likely that they are heading for a recession. However, the US Administration and Fed Reserve are fully alive to the situation and will do their best to ensure that suitable remedial measures are taken to protect the US economy. We have seen aggressive rate cuts by the Fed Reserve in January and there will be more to follow. Our Reserve Bank has refused to follow suit and is adopting a policy of status quo as far as the interest rates are concerned. This has led to a sharp differential (475 basis points) in the interest rates of the two countries. This is only likely to increase further when the FOMC meeting takes place next in Mar.

Water tends to flow where it has least resistance. Similarly, money tends to flow where the returns are better. The returns in Emerging Markets are likely to remain better than in US. And, within emerging markets, India, which is less dependent on exports to US and is growing largely on domestic consumption, is likely to continue to grow at over 8.5% in the next two years, at least. So, whether they like it or not, there is no choice for the US funds and institutions, but to invest in India. And, once the liquidity returns, one can imagine what it will do to the stock market, which after the recent correction is at a much healthier valuation. We have all seen what liquidity did to Indian markets in 2007, where even at a PE of 25, analysts on the media were crying hoarse to justify the rich valuations. And now, when we are down to a more reasonable PE of 17-18 times FY09E earnings, the analysts are predicting as if there is no tomorrow. All one has to do is to have conviction and start buying into fundamentally good companies, which are more oriented towards domestic consumption. So, all those retail investors and even some institutions who felt they had ‘missed the bus’ can safely think of ‘boarding’ the bus now that the valuations are more attractive.

Can the markets go down further? Yes, they can. I am not saying they will not. But then, we do not have to buy at the lowest. When the markets turn around, they may again lead to a sharp recovery. Though, I must admit that we are more likely to have a slow and gradual improvement rather than a V-shaped recovery. Nevertheless, there is not going to be too much of a difference between buying now and buying then. So, looking at things in a different light, this seems to be the best time to buy.

Good Luck!!!
Read the Full Post Here