


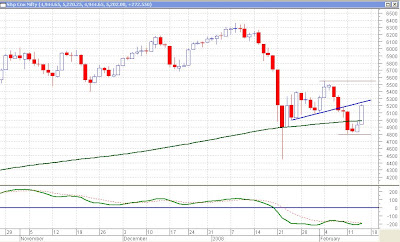
Looking at the last 7 days chart of the Nifty on this daily chart, we find that there is one blue candle, one red candle, one blue, one red and so on. This, along with the narrow range trading, indicates confusion and indecisiveness in the market. The green line just below today’s candle is the 200-day moving average of the Nifty. A close below that would be dangerous. Fortunately, it recovered before it reached there and closed the day about 80 points in the green. While the Nifty is expected to remain in this broad range of 4800-5500, there is support at the 200 day MA at 5030 and resistance, near the previous pivot high formed last week, at 5368.
 On the daily chart of Larsen & Toubro, the stock has made a higher low yesterday and is now near its resistance line. With a stop loss of 3385, it seems to be a good buy if it crosses 3520 and it looks good for a target near 4000. Notice the RSI also turning back upwards after touching 40.
  Ranbaxy was recommended in the newsletter of 22nd Feb. Unfortunately, on that day because of weak markets it didn’t cross our recommended level of 425. Today again it has knocked against its resistance line. The levels, now too, remain the same. Buy above 425 for a target of 500. However, we have now modified the stop loss from 340 to 390.
  Look at this daily chart of Reliance Communications. Two doji days (days having open and close at almost the same level) now with today’s doji with a long lower shadow should be a good bet. Also notice the positive divergence (price going down but RSI going up) between the price and the RSI. Also the RSI fails to breach the 40 level this time around. All these are positives for the stock. Look to buy above 600 with a stop loss of 550 for target prices of around 700 and then 800.
  This is the daily chart of State Bank of India. The trendline seen on this chart has been drawn from the lows made in April 2007 at a level of 915. It has been 10 months now and the stock is still finding support near this line. Touching of the trendline today and a doji day with long lower shadows with RSI above 40 are positives for this public sector bank. One could buy it above today’s high of 2140 for a target near 2600. There may be some resistance near 2280 so be careful around those levels. Keep a stop loss of 2050 for this purpose.
  We again have a chart with a trendline drawn from the lows formed in April 2007 (of course, that time it had a face value of Rs.10/- as compared to the Rs.2/- now). The price of Suzlon Energy today touched this trendline and is currently trading below its 200 day moving average at 319, with today being the 4th consecutive close below it. Stay away from it for the time being. All long positions should be closed on a close below 290.
Happy investing!!!


 Aditya Birla Nuvo seems to have broken out of this downtrending channel on its 30 minutes chart. This may be bullish for the stock. Consider buying above 1800 with a stop loss at 1760 for a target of 1880.
  Hindustan Constructions, on its 60 minutes chart has formed an unconfirmed inverted head and shoulders pattern. This pattern would only be confirmed it the price were to go above 175 with high volumes. A good test of volumes would be to compare it with the current volumes. The current volumes, on an average are about 2.5 lakh shares every hour. So, if the volumes are about 4 or 5 lakh shares in an hour’s time, and the price is above 175 then it would be a good time to buy the stock. The stop loss should be set at 150 and 250 should be a reasonable target for this pattern, once it is confirmed.
  IDFC has broken through this straight trendline on its 30 minutes chart. This trendline has been tested 6 times in the past 20-25 days (marked by the blue arrows). Only on two occasions has it given a false signal when it was breached without any resistance. It would make sense to buy it above 200 with a stop loss of 193 for a target near its previous recent highs of 215.





