

Today is a good day to discuss how to change our trading approach when the market opens with a gap up or gap down. Well, investors shouldn’t bother with gap openings because when one is investing for long term, a few rupees here and there would not make too much of a difference to their returns. For day-traders and swing traders, it definitely will. So, it is these traders who have to modify their strategies. It is best not to change your approach after market opening because that leads us to panic. Rather, make it a rule so that gap openings don’t bother you. If one follows these 10 simple rules, it will save them a lot of tension and ‘high BP’. The rules are as follows:
- Before the market opens, you should have pre-decided entry levels, stop losses and targets.
- Never enter a trade in the first 30 minutes.
- Enter a long position only if the price goes above the high of the previous 30 minutes. If it does not do that, just wait.
- Similarly, enter a short position only if the price goes below the low of the previous 30 minutes. If it does not do that, just wait.
- If you still haven’t entered the trade, again follow rule number 3 and 4.
- If the stop loss or the target is hit before the entry, just forget about the trade. Do not enter at all.
- If the difference between the target price and entry price is very low, and it seems that you are taking too much of a risk compared to the reward, do not take the trade.
- ALWAYS exit at your target. DO NOT be greedy.
- If at all you want to be greedy, at least close 50% of the position and be greedy on the remaining 50%. Modify the stop loss to your purchase price so that you don’t end up with a loss on the remaining 50%.
- If you are already in a trade (carried forward trade) and the market opens below your stop loss for the day, immediately close the trade.
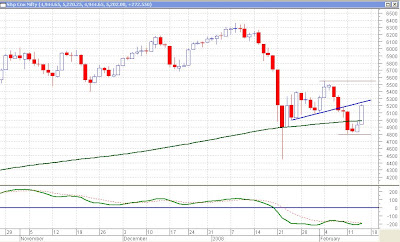
Now, lets discuss the Nifty. As seen from the daily chart of Nifty above, there was some hope. The Nifty, which had on three consecutive days closed below the 200 day moving average, today managed to cross it and with quite a margin. This move changes the short term trend to up but the intermediate trend still remains down. The intermediate trend will change to up when the Nifty crosses the brown line (previous high), which happens to be at 5545. Meanwhile, it should also not cross below the previous low of 4800 or its 200 day moving average at 4992. Meanwhile, the Nifty now lies very close to its next resistance at 5260, as shown by the blue line.
 Aditya Birla Nuvo seems to have broken out of this downtrending channel on its 30 minutes chart. This may be bullish for the stock. Consider buying above 1800 with a stop loss at 1760 for a target of 1880.
 Hindustan Constructions, on its 60 minutes chart has formed an unconfirmed inverted head and shoulders pattern. This pattern would only be confirmed it the price were to go above 175 with high volumes. A good test of volumes would be to compare it with the current volumes. The current volumes, on an average are about 2.5 lakh shares every hour. So, if the volumes are about 4 or 5 lakh shares in an hour’s time, and the price is above 175 then it would be a good time to buy the stock. The stop loss should be set at 150 and 250 should be a reasonable target for this pattern, once it is confirmed.
 IDFC has broken through this straight trendline on its 30 minutes chart. This trendline has been tested 6 times in the past 20-25 days (marked by the blue arrows). Only on two occasions has it given a false signal when it was breached without any resistance. It would make sense to buy it above 200 with a stop loss of 193 for a target near its previous recent highs of 215.
Besides these Indiabulls, LIC Housing Finance (above 280), State Bank of India and Welspun Gujarat (above 450) also seem to be good buying opportunities. The charts for these have not been given.
Happy investing!!!


 Yesterday we had shown the daily chart of Nifty along with the MACD indicator. The details of the calculation and construction of this indicator are beyond the scope of this newsletter but as was explained yesterday, we get a buy signal when the green line goes above the red line and a sell when the green line goes below the red line. Today, we have taken the MACD on the 30 minutes chart. Not only that the buy and sell signals have been marked with arrows on the charts and we can see that they were pretty good signals. If one had taken all signals (buy and sell) on the Nifty based on the MACD from 17th Jan till today, one would have made a profit of approximately 1250 points on one unit of Nifty or Rs.62500 on one lot of Nifty (50 units). But that is not we are discussing here. This was just to give you an idea about how effective this indicator can be and this was in a market which has given many whipsaws (signals which resulted in a loss) especially between 24th Jan and 1st Feb. Another important, and the more relevant, thing to note is that the MACD has given a buy signal again today. With the stop loss (4805) only 30 points away now, this trade could easily be taken.
 Looking at small profits there are a few buying opportunities available. One such stock is Andhra Bank, which seems to have completed its downtrend as its downward sloping trendline has been broken. Narrow range bars in the end with high volumes may signal accumulation. Look to buy above 86.50 with a stop loss of 82.50 for a target near its next resistance near 92.
  Similar chart in Alstom Projects (APIL). With a stop loss below 655, it may be bought above 700 for a target near 750.
  Jindal Steel also may have completed its downtrend, though, it still hasn’t gone above its trendline. With a stop below 1900, look to buy above 2100 for a target near 2450-2500.
 What is a moving average? Till now, I have been using trendlines on my charts in the newsletter and I’m sure all of you would be aware of trendlines and their significance and the supports and resistances provided by them. In simple words, trendlines are sort of an average of prices and it is expected that prices will find support/resistance there. Moving averages are basically moving trendlines and they are actually an average of the closing prices of the price of ‘x’ number of days. Most significant moving averages used by chartists are 5 day moving average (DMA), 10 DMA, 20 DMA, 50 DMA, 100 DMA and 200 DMA depending on the time period one is looking at. It is generally said that the index/stock is bullish above a trendline and bearish below it. Prices below the 200 day moving average are indicative of a bear market. It has been seen in the past that the prices have been able to close below the 200 day moving average but soon cross over again. I would, personally, give the Nifty some time to recover. If it were to stay below this moving average for the next five sessions, then I would have a very negative view on the market . Five consecutive closes below it will be bad for the markets.
  blue lines. This was a 450 point wide channel and it broke through the channel at a level of 5170-5180. Considering that the breakdown is also of the same magnitude it gives us a target of 4720-4730. The green lines shown here at 5035 and 4900 are just minor supports inbetween.
 downtrend) and then prices consolidate within a range (which could be a straight or a rising or a falling rectangle or could be a rising or a falling wedge) and then the prices break out of the consolidation and continue the previous trend which was in place. The ‘horrifying’ thing is that such patterns are formed approximately half-way between trends. And if this indeed is half-way then the target for the end of the trend is, hold your breath, 3820.
 sloping trendline drawn on the weekly charts. The moment this trendline is broken that would be the first signal that a long-term bear market may be approaching. The actual confirmation would come when the previous low (which is at 4002) is broken. That is why we say that till the time 4600 is broken, we should remain buyers on dips.
 The Sensex went down by 612 points today while the Nifty closed 189 points in the red. The markets were pretty flat in the first half of the day and they started slipping shortly after noon. Our support of 5170 did provide some sort of support but soon that too was broken. That brings us to wait for our next support at 5000 levels. As seen from this 30 minutes chart of Nifty, the support of 5170 held only for an hour or so and the next hour brought the Nifty further down. While there is some support near 5000, but the target for this kind of a pattern breakout is near 4800. In the long term, we are still in a bull market, at least till 4600 is not broken. Any dips like these should be used by investors to pick up quality blue chip stocks. You will notice that after such a downfall the bluechips are the first ones to pick up.
 Bharti Airtel has been in a range for a few days now. It was a doji day today (marked with an up arrow). As suggested yesterday, dojis are usually formed either at short term market tops or short term market bottoms. This doji forming near the bottom end of the range suggests that it may move back to its upper end. The RSI finding support near 40 on 29th Jan (marked with a down arrow) gives us some confidence about its strength. This telecom stock will give us a buy signal if it crosses above its trendline near 960 but for now we will keep our eyes are set on a small target of 950-960. Keep a stop loss below 870 for this purpose.
  Nagarjuna Fertilizers, on its daily chart, has bounced back after trading near its support for sometime. The breakout in volumes is a positive for the stock. Depending on from where and to where the trendlines are drawn there seem to be two resistances near 70 and 75. One can buy it near the current market price of 52 and with a stop loss of 42, wait for a target of 70.
  Reliance Petroleum has been in a small range between 150 and 180 for the last 15-20 days on its end of day chart. This range may break soon. With a stop loss of 150, it is looking good for a target of between 210-220 if one buys it above 183. But buy only if it crosses 183. We don’t want to get stuck in a range for another month (in case it does not break out of it) or see it breaking it on the downward side. Avoid any positions in the first 15 minutes.
 The Nifty remained in a very narrow range today. A movement of just 87 points in a day is nothing for the Nifty, especially when you compare it with the average range of 240 points for the last 10 days. A narrow range suggests indecision, as does a doji. A doji is when the closing price and the opening price is exactly the same or almost the same. A typical doji will have a candle which has an upper shadow and a lower shadow but no (or a very small) body. A narrow range day will have a small body but also small upper and lower shadows. These periods of indecision come generally at the market tops or market bottoms. The blue arrows on this daily chart of Nifty shows the dojis and narrow ranges and one can see that they have, generally, been formed near the tops or near the bottoms.
 DLF is touching its resistance near 900. While there is nothing to tell us that it might go through its resistance but the very fact that it has tested this resistance 9 times in the last month and the fact that resistances do get broken sometimes, it may be time for it to go through it. On breaking out, there is evidence of it having a target of 1120 but we should be happy with a more conservative target of 1000 in this range bound market. Consider buying above 900 with a stop loss of 858 for a target of 1000. Avoid doing anything in the first 15-20 minutes of market opening.
  Financial Technologies has been consolidating in a range for some time now. Again, like DLF, there is nothing to suggest that this consolidation phase may be over but when the stock is near its support or resistance, we have to be prepared that if the stock does break out then what? Seeing the stock chart we see that it has some resistance near 2282. We should prepare ourselves to go long if the price were to go above this level. So, what do we do if it does not go above 2282? We wait till it does go through or we don’t take the trade till it remains below 2282. It has been making higher highs and higher lows and seems to be in a consolidation cum uptrend or an uptrend within a consolidation. So, with a stop loss of 2200, we go long if it crosses 2300 and we may well get a target of 2600. Avoid touching in the first 15-20 minutes.
  Jindal Steel also has a chart similar to Financial Technologies. It has been showing a pattern of higher highs and higher lows within this long consolidation pattern and now seems to have broken out of it, as looks evident from the increase in volumes on breakout. It can be bought above 2630 with a stop of 2300 for a target of 3100. But what does one do if the Nifty continues with the consolidation or breaks down? What happens to all these stocks? Well, they may still go up even if the Nifty remains down. This is why individual stop losses for all these stocks are taken into consideration.
  Bhagwan jab deta hai, chhapad phaad kar deta hai. That is true for chart patterns too. We again have a similar pattern in this 30 minutes chart of Neyveli Lignites with the volumes also increasing considerably on breakout. If one buys above 171 with a stop loss at 150, I don’t think a target of 210 will be too far off.
  It is all becoming a little monotonous by now. RNRL again has the same pattern so wont go into the details of explaining the pattern but just notice the increase in volumes on breakout. Buy above 155 with a stop loss below 142 and a target of between 200-210 should be achievable.
 This is exactly what happened with me. You know how bearish I was a couple of days ago. I now realize that I was also fooled by the market. And suddenly, two days later the situation has become totally different. The Nifty, which was finding it difficult to go to its upper end of the range, suddenly broke its downtrending line (drawn over 25 days on the 30 minutes chart) and has now reached the upper end of the channel. So, the wisest thing for me, and all of us, would be to forget that bearish mood and to get ready to enter the markets with a long position.





