Click on the charts to view a larger picture. As seen on this 30 minutes chart of Nifty, it wasn't a day of big movements but it did open down, went up in the morning hours and came down in the afternoon to close at 6174 but the entire day's movement was not enough to take it below our support line of 6150. The RSI is still not presenting a very rosy picture. We are in a short term downtrend which will end when the Nifty goes above 6250. A close below 6110 (or even 6140) will take us to our next support level of 6060.
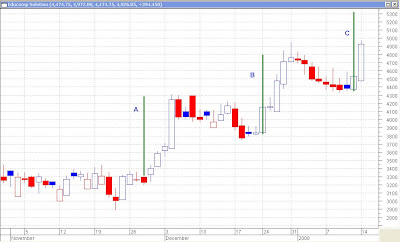
 This daily chart of Educomp shows that it had made a flag pattern in late November/early December, the target for which was given by line B. Note that the length of line B is the same as the length of line A. Now, it turns out that it has made another flag pattern and the target should be the same as the length of line A or line B and is represented by line C. Consider buying above 5000 with a stop loss of 4500 for a target of 5400.
Happy investing!!!


No comments:
Post a Comment