Today is a weekend and on weekends I, usually, write about general things for which I don’t get time during the week. On previous occasions, I have written about mutual funds, the US Recession, Retirement Planning, Greed and Fear, Renewable Energy, Price to Earnings Ratios, Rules for Analysing Charts, why technical analysis works, Fibonacci Techniques and have done a couple of webinars also. The whole week a question keeps propping up in my mind that what am I going to write about this weekend and sometimes my mind draws a blank and I don’t know what to write about. Today happens to be one such weekend. Maybe you readers can give me some ideas about what I should write about. Just send me a list of topics about which you need some more information and I can keep picking up a topic from the list and every weekend I can write about a different topic. I hope to get a list which could last me 2-3 months. So please send in your lists today.
Though, I didn’t know what I should write about, but then I thought why not write about something which seems to be driving our markets. And in my opinion, there are three things that are driving the Indian markets, namely, inflation, crude prices and the American markets. Inflation, I feel, is more because of the shooting commodity prices the world over rather than being an Indian phenomenon. The government is trying to control inflation by regulating the supply of commodities or by raising interest rates but when the inflation is driven by external factors how can we control it with these measures? Though, I’m not much of an economist but I feel there could have been better ways to reduce inflation than this. I’m shocked at how horribly wrong the Govt. was. According to this news report the Central Government had said on April 19, 2008 (when the inflation was 7.14%) that they would bring down the inflation under 5% in the next two months.
Well, about crude prices the sky seems to be the limit to which the crude prices can go? Will this never end? Will crude go to $200 a barrel? When I don’t understand anything I make use of technical analysis. But I have done the technical analysis of crude in an earlier post too with the help of Elliott Waves and had suggested that crude could make a high near 6300 or $148.50. Things have changed today. Crude, after a $10 jump that day slowed down and is now gradually inching up. This gradual increase has pushed the target upto between 6500 and 6600 (in rupees), which means it could go upto $157 a barrel. But I also saw the short term chart of crude and I found it to have some similarities with the chart of the Nifty. Let us see how.
 Seen above is the daily chart of the Nifty showing the period between November 2007 and January 2008. Significant in this chart is the presence of dojis. I’ve mentioned in numerous other posts that a doji is a day when the open and the close of the day is the same or is very close to each other. In this case, the candle that is formed has an upper shadow and a lower shadow but a non-existent or a very small body. All such dojis have been marked in the chart above with green arrows. Dojis are signs of indecision/confusion. Such indecisions and confusions cause a strong trend in the market to slow down and then reverse. This is exactly what happened in late January after a series of dojis were seen in late November, all of December and the initial part of January. Another thing to note in the chart is the presence of the ADX index which measures the strength of a trend. A strongly trending stock/index will show higher values of ADX while a trend slowing down or a stock/index going through a consolidation will show lower values of ADX. This ADX, which was as high as 47 in late October came down between 15 and 20, when the Nifty actually reversed.
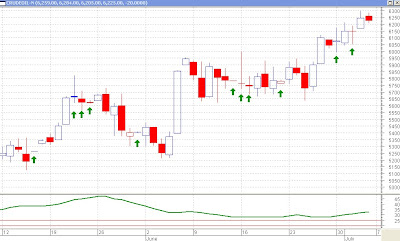
 Let us look at the crude chart for the period between mid May and now. The similarities seen are obvious. This chart also has seen a number of dojis in the last two months, though, may not be as many as were seen in the chart of the Nifty. Looking at the ADX indicator, we can see that here too it made a high of 47 and then came down to levels between 25 and 30 and is now at 33. The striking resemblance between the two charts shows us that the high for crude oil may not be very far off. What also cannot be ignored is the presence of so many red candles. The chart looks more red than blue even though this chart is of a period when it has been in an uptrend.
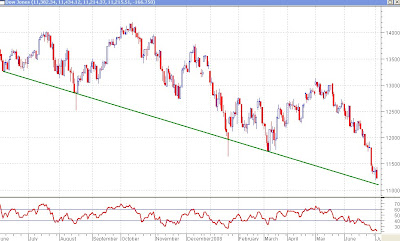
 And lastly, let us take a look at the American markets too. Seen above is the chart of Dow Jones Industrial Average for a period of last one year. We can clearly see that the trend has been downwards. The chart currently shows no indications of the downtrend finishing or an uptrend building up. But there are a couple of things which I want to share with you. The first is the trendline drawn from June 7, 2007 till date. This trendline shows that there may be support nearby near 11100. And a one year long trendline, which has been tested 4 times in the past should provide a pretty strong support. Secondly, the Relative Strength Index (RSI) is currently near 20 and considering that the downtrend has been in place for the last 9 months, a level of 20 is highly oversold which has never been seen in the last year, at least. Both these things show that a support, could only be a short term support, is nearby. And that is what we are expecting with the Indian markets too. More downside possible but a short-term low may have been formed.
Please do subscribe to my posts, so that all posts are delivered free to your inbox and you don't miss any useful analysis of the markets in the future.
Happy Investing!!!


No comments:
Post a Comment