Sunday, August 31, 2008

4200 Provides Support, Nifty Trend Remains Sideways

The Nifty opened with a good positive gap on Friday and continued to reach higher levels throughout the day on Friday. In earlier posts it has been mentioned that the Nifty would should, find support at the lower end of the rectangle which happens to be at 4200. The low touched on Thursday was 4201. The 30 minutes chart had shown a breakdown through a symmetrical triangle, the target for which was 4160, which coincided with the most recent pivot low formed on the daily charts (4159). So, it was expected that the range between 4160 and 4200 would provide good support. And 4201 happens to be the level from where the Nifty turns back.

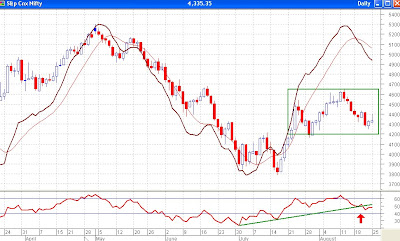
Nifty Daily Chart, RSI Finds Support at 40

Seen above is the daily chart of the Nifty along with the Relative Strength Index (RSI). As seen in the chart above, the RSI has found support at 40 at the same time as the Nifty found support near the lower end of the trend channel at 4200. This seems to be a short term bullish for the markets and as mentioned in Thursday’s post, the outlook for the future remains the same since the Nifty is still locked between the range of 4200-4650. In short, in the very short term further downside may have been avoided for now but from a short to a medium term perspective, the trend remains sideways. A clear direction would be known only after one of these ranges. For now, we shall wait for the Nifty to reach 4650, or for the point where there is a return line failure. A failure to reach either the top or the bottom of a trend channel is known as a return line failure.

Please do
subscribe to my posts, so that all posts are delivered free to your inbox and you don't miss any useful analysis of the markets in the future.

Happy Investing!!!

Read the Full Post Here

Thursday, August 28, 2008

Nifty Breaks Down Further, Support Between 4160-4200

Exactly like yesterday, the Nifty opened flat today and almost immediately started losing ground but stabilized soon and then went into a narrow range and kept trading in those levels for most of the day. The bears, finally, took the index below the lows of the day when only an hour of trading was left and the index ended the day about 78 points in the red. The Nifty still remains locked inside a range of 4200-4650. As mentioned in earlier posts, a clear trend would come about if this range is broken on one of the sides. Or when the ADX indicator line starts rising again. This line seems to be stabilizing near 14. Such extremes are rare in the ADX and this clearly shows that a trending should now come about soon enough.

Nifty Daily Chart - Reaches Lower End of Range, Supoort Between 4160-4200

Seen above is the daily chart of Nifty and shows the range within which the index remains locked. The lower end of the range is shown at 4200. However, as explained in yesterday’s post, the index has broken a symmetrical triangle within which it was moving on the downside. The target for this downside breakout is 4160. If we look at the chart above and notice the pivot low which was formed in the end of July, the value happens to be 4159. So, this 4160-4200 range may provide good support to the Nifty. Looking at the Relative Strength Index (RSI), we find that it is now very close to 40. If the RSI does find support near 40, it may mean that all is not lost yet. A breakdown below this range of 4160-4200 should definitely take the RSI below 40 and that would be negative for the markets, and we could be looking at 4000 or 3800 then. Alternatively, if the Nifty were to find support near these levels and the RSI near 40, then the outlook remains, more or less, the same that we would still be in a sideways market but would be saved from the downside, for some time at least.

Please do
subscribe to my posts, so that all posts are delivered free to your inbox and you don't miss any useful analysis of the markets in the future.

Happy Investing!!!

Read the Full Post Here

Wednesday, August 27, 2008

Nifty Breaks Symmetrical Triangle On The Downside

The Nifty opened with a small upwards gap today and almost immediately started losing ground. It then went into a very narrow range of about 20 points and kept trading in those levels for the better part of the day. The bears, finally, took the index below that narrow range of 20 points when only an hour of trading was left and the index ended the day about 45 points in the red. The result is still the same, the Nifty locked inside a range of 4200-4650. As mentioned in earlier posts, a clear trend would come about if this range is broken on one of the sides. Or when the ADX indicator line starts rising again. This line was showing a value of 15 yesterday and today it has fallen further to 14. Such extremes are rare in the ADX and this clearly shows that a trending should now come about soon enough.

If we look at the charts in the posts written yesterday and the day before that, we would notice that the Nifty first made a gravestone doji (a bearish signal), and the next day it formed a dragonfly doji (a bullish sign) and today it fell down. A number of days before those dojis too it had been making red and blue candles on alternating days. A clear signal that the markets are confused and do not know which direction to take. That explains the narrow range that we are locked into.

Nifty 30 Minutes Chart - Symmetrical Triangle Broken, Target 4160

Seen above is the 30 minutes chart of the Nifty and shows the short term trend of the market. As seen above this narrow range that the Nifty was locked into during the last one week was in the form of a symmetrical triangle. The apex of the triangle was reached today and the Nifty saw a breakthrough on the downside. The target for this breakdown is close to 4160. It is quite possible that the Nifty may complete a pullback to 4370 again before falling further. That rise could be used to take short positions (or to exit longs) in the short term.

Please do
subscribe to my posts, so that all posts are delivered free to your inbox and you don't miss any useful analysis of the markets in the future.

Happy Investing!!!

Read the Full Post Here

Nifty Trend At The Slowest This Year

The Nifty opened weak today and remained flat for the next couple of hours today. It was only at noon that the upmove started and except for a small three quarters of an hour long correction at about 1pm, it remained a unidirectional move for the Nifty from 12 noon. This move was so good that the Nifty, which was about 50 points in the red, managed to close 2 points in the green before the day ended. In the process, it formed another doji and this time it was a dragonfly doji, generally a bullish sign. This is what Street Authority says about a dragonfly doji.

Dragonfly Doji
Nifty Daily Chart - ADX at the Lowest This Year

Seen above is the daily chart of the Nifty along with the Directional Movement ADX Indicator. As mentioned in earlier posts, the Nifty is locked inside a trading range inside 4200-4650, as is shown in the green rectangle. The directional movement ADX indicator is the speedometer of a trend. Like the speedometer of a car measures the speed of the car, the ADX indicator measures the speed of the trend. We get a rising line when a trend is in place, irrespective of whether it is a downtrend or an uptrend, and a falling one when the market slows down and is going through less volatile patches. Values below 20 means that the markets are currently inside a trading range and a move outside the trading range should be profitable. Values above 25 should be traded depending on the direction of the trend. Values between 10 and 15 are considered to be extreme values and rarely does the ADX indicator fall below this range. A rising line from these levels seen in conjunction with a breakout may be a good time to enter the trend.

Please do
subscribe to my posts, so that all posts are delivered free to your inbox and you don't miss any useful analysis of the markets in the future.

Happy Investing!!!

Read the Full Post Here

Tuesday, August 26, 2008

Nifty May Perform Poorly

As expected, with global cues being strong, the Nifty did open with an upwards gap of about 70 points and then stabilized around those levels till about 12:30pm and then commenced falling. The fall was sharp and severe and the gap with which the market opened, was filled/closed today itself. The Nifty closed exactly at the same level as yesterday’s close and thus formed a gravestone doji. If one looks at the chart, it does not exactly look like a gravestone doji because NSE takes the closing price as the average of the last 30 minutes of trade. Taking actual closing prices of yesterday and today, one can realize that this is a gravestone doji. This is what Street Authority says about a gravestone doji.

As I said in yesterday’s post, the Nifty has been alternating between up days and down days since the last 5 days. Though, today also happens to be a day marginally in the green, yet a gravestone doji (or a candle with a long upper shadow and a small body) is a sign of weakness. This should bring the markets down and the Nifty may finally find support between 4150 and 4200. If 4150 is also broken on the downside, we should be looking at a target between 3800 and 3900. The trend, as yet is not clear. We are in a short term downtrend while the intermediate term is sideways. To predict/forecast analyse, what will happen in the short term and the intermediate term, I am doing the analysis on both the 30 minutes charts and the daily charts.

Nifty 30 Minutes Chart - Positive Divergence But RSI Finding Resistance at 60

Attached above is the 30 minutes chart of the Nifty. Seen on the chart is a trendline joining the different pivot highs and lows made during the month of August. Shown in the bottom portion of the chart is the Relative Strength Index (RSI) and superimposed on the prices is the Moving Averages Convergence Divergence (MACD). Let us discuss each one in detail and try and analyse which way the prices will move in the immediate short term. First, let us look at the RSI. The RSI today made a pivot high higher than the last pivot high which was made on 20th. The prices corresponding to these highs are seen making lower highs. Looking at the lows formed in the Nifty on 18th and on 22nd, the RSI at the same time is seen at the same level and is not making newer lows. So, as marked by the green arrows, there are two instances of a positive divergence occurring between the price and the RSI. But a divergence is just an indication of a reversal and not a confirmation. A confirmation will come if the trendline is broken towards the upside, i.e. if the Nifty were to go above 4370. If it turns back tomorrow and does cross 4370, it would also have made a small bullish head and shoulders pattern, the target for which would be close to 4520.

But like all coins, this has a flip side to it too. Coming back to the RSI, as marked in the circles, we can see that the RSI is finding resistance near 60, which is not exactly a sign of a bull market. Looking at the trendline, we can see that today was the sixth occasion that the Nifty tried to go above the trendline in this month but failed. Assuming that this would continue to provide resistance would be bearish for the markets. Also looking at the MACD which has been superimposed on the prices, we can see that unless the Nifty recovers drastically tomorrow, we shall get a sell signal from the MACD too.

Nifty Daily Chart - MACD Still Bearish, RSI Breaks Support

Above is the daily chart of the Nifty and an attempt has been made to study the intermediate term trend of the Nifty. As mentioned yesterday, the Nifty has now entered a sideways phase between 4200 and 4650 and would not give us a clear signal till it comes out of this range either on the upside or on the downside. If we have a look at the RSI, we can see that it has now broken the trendline which was providing support to it since the last few days and has bearish implications. These bearish implications would be cancelled if the RSI finds support near 40 and turns back. As far as the MACD is concerned, as mentioned in a post a few days ago, the sell signal which was generated is still valid and again has bearish implications for the markets. So, all in all, I am expecting the markets to perform poorly in the next 2-3 days.

Please do
subscribe to my posts, so that all posts are delivered free to your inbox and you don't miss any useful analysis of the markets in the future.

Happy Investing!!!

Read the Full Post Here

Monday, August 25, 2008

Nifty Entering Sideways Phase, Range Between 4200-4650

Friday was a reasonable day for the Nifty with it gaining about a percent from the closing price of Thursday. The American markets and the European markets were much better too on Friday than the day before. There happens to be good news on the crude front too. After reaching highs of $121.50 and thereabouts on the previous day, crude slipped to $114.75 on Friday. Looking at the global cues, it does seem like Monday is going to good for the Indian markets too. However, there were some negatives too. Not all seems to be going hunky dory for India as far as the nuclear deal is concerned. The NSG has agreed to meet on Sep 4, 2008, and in the meantime, will suggest changes to the India specific clauses of the agreement. Inflation increased still further to 12.63% for the week ended Aug 9, 2008.

Nifty Daily Chart - Trading Range Between 4200 and 4650Seen above is the daily chart of Nifty. As can be seen, the last four candles have been alternating between blue and red. Simply speaking, one day has been ending in the red while the next has been closing in the green. This alternation clearly shows that the market is now becoming uncertain about its next move and is now probably entering a sideways phase with the range as shown i.e. between 4200 and 4650. Since the markets are in a range, nothing much can be said as of now till this range is broken either on the upside or on the downside.

Please do
subscribe to my posts, so that all posts are delivered free to your inbox and you don't miss any useful analysis of the markets in the future.

Happy Investing!!!
Read the Full Post Here

Thursday, August 21, 2008

Nifty Bounces Back From Fibonacci Support

The Nifty recovered today, as we had been expecting in the last two days. The signals were quite evident as there were multiple supports available between 4330 and 4380, as was mentioned in the post titled “Multiple Supports for Nifty Between 4330 and 4380”. While writing the newsletter last night, the global situation was bad but the Asian markets were good in the morning. The American markets today are flat while the European markets closed marginally in the green.

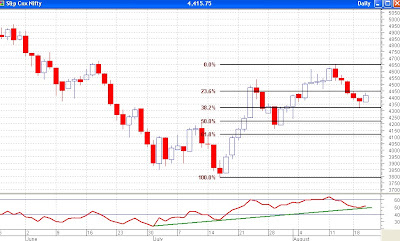
Nifty Daily Chart - Fibonacci Retracement Levels

Pasted above is the daily chart of Nifty zoomed in to see the most recent data along with the Fibonacci retracement levels. The rally that started in the middle of last month and which continued till the middle of this month and which measured almost 800 points has retraced by 38.2% and exactly from those levels it turned back. Fibonacci retracement levels are very helpful to determine support and resistance levels for the markets.

Not shown on the chart, but which was part of my analysis today, was the retracement levels of the recent decline from 4650 to 4316 and I found that during the current rally the market would retrace 38.2% at 4450, 50% at 4485 and 61.8% at 4520. So, these are some of the resistance points for the markets. 4450, as can be seen on the chart above, also happens to be the 23.6% retracement level which again should provide resistance. That does not mean that it will find resistance and turn back at one of these levels, but it remains a possibility.

Mr.
Sudarshan Sukhani, a noted Technical Analyst, in his blog post today mentions that the Nuclear Suppliers Group, which is to meet on Thursday, is likely to approve the India specific nuclear safeguards agreement. He feels that the current rally may be discounting that news in advance and he is expecting a euphoric surge once the news does come through. He advises his readers to book profits during that euphoria as the positive effects out of the deal will be seen 10 years from now and that it is just not worth an increase in the markets now. I somehow agree with his view. In any case, I expect the markets to remain range bound and the possibility of the markets crossing 4650 in this rally remain bleak. If the Nifty does manage to go above 4650 in this rally, I would be proved wrong by the markets one more time.

Please do
subscribe to my posts, so that all posts are delivered free to your inbox and you don't miss any useful analysis of the markets in the future.

Happy Investing!!!

Read the Full Post Here

Wednesday, August 20, 2008

Some Positives, Some Negatives

Based on weak global indicators, the Nifty opened with a slight negative gap and for most of the day held and traded above the support of 4330. For a brief period of time, after 1 pm, it did go below 4330 to make a low of 4316 but soon recovered from those levels and the recovery at 2 pm was remarkable. Had it not been for the average calculation method of Nifty to calculate the closing price, we would have had another doji candle today.

Nifty Daily Chart - MACD Gives Sell Signal

Seen above is the daily chart of the Nifty. As suggested in yesterday’s newsletter the Nifty was likely to find support between 4330 and 4380 and though, it did overshoot the lower end of the target by about 15 points and eventually closing better, we shall consider it as a successful test of support. As can be seen on the chart by the dotted trendline, the Nifty did find support today near the line.

Also seen on the chart is the Moving Averages Convergence Divergence (MACD – not to scale), an oscillator indicator which gives excellent signals. It is calculated as the difference between two exponential moving averages of the prices, known as the slow and the fast moving averages. Usually the slow moving average is the 26 period moving average while the fast moving average is usually the 12 period moving average. This has been graphically illustrated as the brown line on the chart above. A 9 day simple moving average of the difference thus calculated is graphically shown as the red line and is also called the signal line. We get a buy signal when the MACD goes above the signal line while a sell signal comes when the MACD moves below the signal line. A quick look at the chart tells us that except for the month of February, this indicator has been giving pretty accurate and quick signals. The MACD has today given us a sell signal.

Well, we are talking of support and a short term turnaround and the MACD is giving us a sell signal? The European markets were down today by between 2-3% and the American markets are trading more than a percent in the red at the moment. Crude oil too jumped up today and after showing a high above $116 a barrel is currently trading in the vicinity of $114 a barrel. So, all global cues, as of now, happen to be negative and except for the technical reasons, there is no reason to expect a recovery. Technically also we have just mentioned that 4330 is a fairly strong support but it can easily be broken if the Nifty so decides. The MACD has also given a sell signal so the market may be coming down now. Well, what is the guarantee that the MACD will not function now like it did in February this year.

All in all, there are some negative cues and some positive ones. So, one should be cautious and let the Nifty decide what it wants to do next. A move below today’s low of 4316 (after 10:30 AM) should be taken as a bearish sign while a sustenance above 4330 should be viewed positively.

Please do
subscribe to my posts, so that all posts are delivered free to your inbox and you don't miss any useful analysis of the markets in the future.

Happy Investing!!!

Read the Full Post Here

Tuesday, August 19, 2008

Multiple Supports For Nifty Between 4330 and 4380

The Nifty went down the fourth day in a row today. That was what this column had been expecting since 6th Aug 2008. To read the analysis of the past few days, you can read the newsletters for 6th Aug 2008, 7th Aug 2008, 11th Aug 2008 and 12th Aug 2008. All this prediction about the fall was made while the market remained in a narrow range and before the actual fall started. Now it has been 4 days into the fall and there are signs of support coming in.

Nifty Daily Chart - Multiple Supports Available

As mentioned in yesterday’s post, there are supports available on the 30 minutes and 60 minutes charts between 4330 and 4350 and on the daily charts near the neckline of the head and shoulders pattern, which could be anywhere between 4330 and 4400. Seen above is the daily chart for Nifty. This chart has three new trendlines drawn and all of them suggest support just below today’s low of 4379. With so many supports available between the 4330 and 4380 levels, there is quite a possibility that this support may hold. In case it does hold, and the Nifty crosses today’s high of 4448, we should become buyers. In case we encounter weakness tomorrow and the Nifty comes below 4330, we are looking at more downside which may (or may not) find support near 4200. Looking at the Relative Strength Index (RSI) also, it can be seen that there is support for it too near the trendline. Despite a fall of 270 points in the Nifty, which works out to roughly 6% fall in the index, the RSI has fallen from 64 to 50 only.

Since so many supports are available at 4330, we should assume that this support is likely to hold. And if it is broken, it will be quite significant for the markets and while the next support is available near 4200, even that may not hold. What the markets actually decide to do is for the market to decide. For tomorrow (today) the plan should be to go long above 4450 and go short below 4330.

Please do
subscribe to my posts, so that all posts are delivered free to your inbox and you don't miss any useful analysis of the markets in the future.

Happy Investing!!!

Read the Full Post Here

Monday, August 18, 2008

Pullback in Nifty Comes A Little More Strongly

The charts haven’t changed much since the last analysis was done on this blog on Wednesday night/Thursday early morning, except that the pullback/fall that we expected came a little more strongly on Thursday. The situation, though, remains the same. We do not know yet whether this is a pullback to the head and shoulders pattern breakout or a pattern failure.

Nifty Daily Chart - Debatable Neckline

Attached above is the daily chart of Nifty, which clearly shows a head and shoulders pattern, a clear breakout and then we are currently witnessing a pullback. As suggested in the last post, it is debatable where the market considers the neckline to be. The neckline could be where we have shown on the chart as the solid green line. It could also very well be near the dashed green line. Or it could as well be anywhere inbetween. This means that the zone between 4430 and 4360 remains a strong support zone. As long as the support of 4360 (levels likely to change with each passing day) is not broken, we should assume this to be just a pullback and not a pattern failure.

I did an analysis of the 30 minutes as well as the 60 minutes chart of the Nifty too but the results were nothing new. The charts don’t tell us anything different and they too suggest a support between 4330 and 4350. Whether or not that support will be broken is difficult to concur right now.

The international front too gives us no triggers. The Dow Jones on Friday ended a tad higher while the London FTSE closed a lot lower. The crude oil, after making a low at $111.30 ended the day at $113.78. All in all, Friday was a mixed day. Except for any major changes in the Asian markets tomorrow morning, the rest of the world triggers would cause no major havoc/euphoria in the Indian markets. The inflation figures were released on Thursday and it was found that inflation jumped to 12.44%, a big rise as compared to what was seen in the past few preceding weeks. Will the markets fall because of that? Well, we can just wait and see what the reaction will be.

Please do
subscribe to my posts, so that all posts are delivered free to your inbox and you don't miss any useful analysis of the markets in the future.

Happy Investing!!!

Read the Full Post Here

Monday, August 11, 2008

Nifty Breaks Out, But Wise to be Cautious

The Nifty opened in the green today on the back of strong global cues. The first minute of the day saw the Nifty trading above 4600. Since then, it has been a very dull day for the Nifty since it made a high of 4615 after that and a low of 4580, a range of only 35 points. This narrow range continued upto 3 pm when the Nifty did manage to go 10 points past its high of the day. The positive opening was good for the markets, the fact that it sustained near the highs was also good and closing near the highs was very good. It is the narrow range during the day that worries me since that is not exactly the sign of a breakout.

Nifty 60 minutes Chart - Breakout Achieved but Resistance Nearby

Seen above is the 60 minutes chart of the Nifty. As suggested yesterday, the index was moving within a falling trend channel, which was looking bullish on the hourly charts since the Nifty went into this channel after a good rally. And a falling wedge or a falling trend channel under such circumstances happens to be a continuation pattern. And as expected, the Nifty did break out of this trend channel on the upside. This pattern breakout gives us a target of 5000 on the hourly charts.

But as already mentioned, it worries me that the Nifty stayed within a very narrow range today after a strong opening. I had mentioned yesterday that a ‘trending’ move may come about and today’s move was definitely not trending in any way. If we look at the tick by tick chart or the 5 minutes chart of the Nifty, we would see that the Nifty stayed sideways all day and didn’t give us a clear trend. What gives us solace was the fact that in the last half an hour it went up above its highs of the day and closed at those levels too.

As for the prediction for tomorrow, there is resistance close by near 4650 while support is also not very far off near 4570. A break out of this range should give us a decisive move. Another worrisome fact is that on the chart, while the Nifty is making higher highs, the Relative Strength Index (RSI), during the same period, is making lower highs, as has been marked by the green arrows. This indicates bearish divergence and a break below 4550 would indicate a trend reversal. So, in spite of the breakthrough today, the Nifty continues to be range bound and it is wise to be cautious. Probably, it is just an attempt to trap the bulls.

My readers would think that even in all this bullishness when the Nifty is moving up everyday, I still talk about bearish things only. Well, I am normally not so bearish but what can I do? This time around this upmove is not giving me the confidence that it normally should. We have seen bullish patterns like a bullish head and shoulders pattern and a falling trend channel pattern but unfortunately the breakouts have been far from perfect. Which is why I continue to stay cautious and that reflects in my writing too. Am I thinking too differently? Tell me readers, what do you think of the markets? What is your view of the markets in the next 2 days, the next 2 weeks, the next 2 months, and in the next 2 years? Let me know how differently I am really thinking. Leave your comments below by clicking on ‘Post a Comment’.

Please do
subscribe to my posts, so that all posts are delivered free to your inbox and you don't miss any useful analysis of the markets in the future.

Happy Investing!!!

Read the Full Post Here

Sunday, August 10, 2008

Trending Move May Come About: Direction Unknown

The Nifty on Friday managed to make another doji candle. That makes it three consecutive dojis, each candle having a lower high and a lower low. Interestingly, each day was a green day, meaning that the Nifty closed with gains on each of these three days. The Nifty ended with 14 points of gains on Wednesday, 6 points on Thursday and 5 points on Friday. A doji suggests indecisiveness and technically signals that the market is taking some rest before starting another big move, which could be up or down. But after a long rally or a long decline, the formation of a doji may signal a reversal in the trend.

In this particular case, a doji was formed after a rally of 800 points from the lows. And we have seen three consecutive dojis since then. This should have signaled the beginning of a downtrend. The fact that it has not means that more analysis needs to go into this. Let us look at the details and the circumstances under which the doji was formed. The short term trend has been for quite some time now. On the daily charts, we have seen a pattern of higher highs and higher lows, which again suggests bullishness and which means we are in an intermediate term uptrend too. On the daily charts, a bullish head and shoulders pattern was formed and a candle going through the neckline should have been a large range candle with good volumes but that turned out to be a doji. On the weekly charts, we are seeing a pattern of lower highs and lower lows, which means we are in a long term downtrend. And it will remain so till we have a pivot low higher than 3800 or if the prices were to go above 5300.

This means that we are in a short term uptrend, an intermediate uptrend but in a primary downtrend. We would expect the market to follow the longer term trend, which remains down. But that does not stop the market from following the short term and intermediate trend before following the primary trend. In such a situation it is best to follow the short term trend. Short term trends can be seen on the 30 minutes or 60 minutes charts. Attached below is the 60 minutes chart of the Nifty from the lows made on 16th July till date. Initially, we saw a big rally and then a corrective period before the rise started again.

Nifty 60 minutes Chart - A Falling Trend Channel

Since the last three days the Nifty has been moving within a narrow range trend channel, as seen on this 60 minutes chart. As can be seen, this is a falling trend channel or a channel sloping downwards. The significance of a falling trend channel or a falling wedge after a long rally is exactly the opposite of the significance of a doji after a long rally. While a doji after a long rally holds negative implications, a falling channel or a falling wedge after a rally is a bullish sign. Another important thing present on the chart is a trendline connecting the lows formed on 16th July, 29th July, 1st August and Friday’s lows. This trendline shows that the Nifty is now at support and may not go down further. The trend channel shows that resistance is at 4550 and should not go above that. But Nifty cannot remain in this 50 point range forever. A trending move should now come about which would take the Nifty above 4550 or bring it below the lower end of the trend channel at 4450. We shall take a position depending on which side the Nifty breaks out on. For now, it is just wait and watch.

Please do
subscribe to my posts, so that all posts are delivered free to your inbox and you don't miss any useful analysis of the markets in the future.

Happy Investing!!!

Read the Full Post Here

Friday, August 08, 2008

Second Consecutive Doji After 800 Points Rally: Not Bullish

Another day which managed to end in the green but only marginally. Today’s gain was 6 points while yesterday’s gain was 14 points. Two days of big movements and a gain of 20 points overall and two consecutive dojis after a rally of 825 points is not bullish. I just returned from somewhere and it is already past midnight. Am not in a position to do too much of typing right now so I have just left my comments on the Nifty daily chart attached below.

Nifty Daily Chart - Second Consecutive Doji

The European markets also ended up as dojis today. They went down a percent, then recovered all its losses and even went up a percent but then lost everything to close marginally in the red. The American markets are down with the Dow having lost 120 points till now. Crude seems to be finding good support near $118 and has now gained almost $2 from this week’s lows and is trading at $119.90 at the moment.

Please do
subscribe to my posts, so that all posts are delivered free to your inbox and you don't miss any useful analysis of the markets in the future.

Happy Investing!!!

Read the Full Post Here

Thursday, August 07, 2008

Nifty Makes A Doji: Time To Book Profits?

It was one of those days today when the Nifty opened with a positive bias due to better global cues and remained high for a better part of the day, only to enter a phase of profit booking and lose all its gains in a little more than an hour's time.

In the process, it seems that the Nifty has made a doji candle. A doji candle is one on which the open and the close price is the same or exactly the same. Which means that a doji candle may have a long (or short) shadows but a virtually non-existant body. An abnormal shutdown during the course of updation of today's prices in my charting software has produced some error on it. Because of this error, I have not been able to attach a chart today. But with the doji coming in after a big move up may signify that the bulls are tiring out and we may see some profit booking now, which in turn would make the outlook for Nifty negative for a couple of days at least.

Seeing
yesterday's chart, we can see that the support was near 4500 as provided by the neckline. Below this, support comes in near the downward sloping trendline which is now near 4400. A move below 4400 could bring it back to 4200 while above today's high of near 4600, it would turn bullish. The head and shoulders pattern cancels below 4150.

Please do
subscribe to my posts, so that all posts are delivered free to your inbox and you don't miss any useful analysis of the markets in the future.

Happy Investing!!!
Read the Full Post Here

Wednesday, August 06, 2008

Nifty Displays Bullish Head and Shoulders Pattern

The Nifty opened flat in the morning today and kept trading within a narrow range and was repeatedly finding resistance near 4420 and it wasn’t until 1PM, after the European markets opened, that it started rising again. The European markets closed very well in the day today with gains over 2 and a half percent since yesterday’s close. Even the Dow Jones right now is trading more than 200 points up in the green. Looking at the crude, after touching lows near $118, it is currently trading at $119.50. 118.20 to 118.50 seems to have provided good support to the prices today.

Nifty Daily Chart - Bullish Head and Shoulders Pattern

Attached above is the daily chart of Nifty, along with a few trendlines drawn in and the Relative Strength Index (RSI). Let us start with the longest trendline in the chart which has been drawn from the beginning of May till date and which has been shown as a dotted trendline. This trendline was quite comfortably passed through during the day today. A second trendline, which happens to be shown as a solid line green in colour, has been drawn from the beginning of June till date. This also happens to be the neckline of the inverted head and shoulders pattern, which has been marked as S, H and S. A vertical line AB has been drawn from the neckline to the bottom of the head formation. This line has then been superimposed at the point of breakout (??) today. This superimposed line AB gives us a head and shoulders breakout target of 5200. It is not clear whether the head and shoulders pattern has been broken through or not yet. I feel it just fell short of confirming it. We would assume that this pattern has been confirmed if the previous pivot high at 4540 is surpassed, which happens to be another 40 points away. If that does happen the RSI also would cross 60, which would have happened in Nifty the first time in three months and only the second time since January, when the downfall started.

Is there anything that could go wrong? Yes, if it happens to be your bad day, everything could go wrong. Looking at the chart, we can see that the head and shoulders pattern has not been decisively confirmed today, which means that it could very well start coming down from here. Looking at the RSI too, we can see that the resistance at 60 has not been crossed as yet. If the Nifty turns down from here, 60 would not be crossed and it would be bearish for the index. If, on the other hand, the RSI crosses 60, we should be looking at further gains. On the downside, a move below 4140 would cancel this bullish head and shoulders pattern.

Please do
subscribe to my posts, so that all posts are delivered free to your inbox and you don't miss any useful analysis of the markets in the future.

Happy Investing!!!

Read the Full Post Here

Tuesday, August 05, 2008

Moody May Downgrade India, Nifty Remains Subdued

It was again a very busy evening for me and I could not devote much time to write and analyse the markets and the charts. However, I feel guilty when I see that my blog generates almost an equal number of page views on days on which I have done no analysis and that all those visitors have to go back unsatisfied. That is why I make it a point to write something for my loyal readers. Today I have thrown in a daily chart of the Nifty with my comments on the chart itself. Please bear with it.

Nifty Daily Chart - Resistance Found at Trendline
Please do
subscribe to my posts, so that all posts are delivered free to your inbox and you don't miss any useful analysis of the markets in the future.

Happy Investing!!!
Read the Full Post Here

Monday, August 04, 2008

Nifty Jumps as IAEA Approves Nuclear Deal

The Nifty, on Friday, opened weak and remained subdued for the first one hour. After a very narrow range on Thursday and with a breakout gap down opening on Friday, it seemed as if the downtrend would continue. However, the market had different things in its mind. Nobody knows what took up or why did the markets improve on Friday because soon after 11AM the markets reversed and since that time it was a virtually a unidirectional upmove for the markets till closing time. And this was despite the negative bias with which the Asian markets closed and the European markets opened. Despite all this negativity all over the world, what was it that was taking the Indian markets up, nobody knew. Later in the evening the news came out that the IAEA had approved the India specific safeguards agreement in the nuclear deal and that the deal would now go to NSG for sanction. The US has promised to get the NSG process expedited.

Nifty Daily Chart - Big Volatility After Narrow Range Day

The daily chart of Nifty, as shown above, shows that after the narrow range day seen on Thursday, we saw a high volatility candle on Friday. This was to be expected, but what was not expected was that it would first give a false downside breakout and then change itself completely during the course of the day. Could it have happened that some market participants had come to know that the IAEA had approved the nuclear deal? It is quite possible since such things keep happening in the Indian markets and the world over that the smart money gets access to important market sensitive news much before the rest of the market does.

Anyways, now that the direction is clear, let us decide what to do tomorrow. Resistance is close by at 4450 (the closing was 4413), only 37 points away. But with the IAEA news now becoming public, that resistance should be broken through in the first one minute of trade. A move above 4450 will give us a sign that the market may now change its intermediate term trend to bullish since, then the prices would have gone above the downward sloping trendline seen in the chart above. But an actual confirmation of an intermediate term uptrend would come if the prices were to go above the previous high of 4540. All of us should be buyers above 4540, while persons with more risk taking capacity can plan to go long above 4450. I would suggest buying some Nifty calls having strike price of 4500 and 4900 for best results. With some luck we should be able to get them tomorrow early morning at Rs.135 and Rs.23 approximately.

It was a busy weekend for me and it is now late Sunday night. I would like to post this entry as early as possible so that then I could go and hit the sack. I will go into the details of why I am suggesting 4500 and 4900 calls tomorrow. I am also planning to discuss what the next target of Nifty should be after the change of trend is confirmed. Please keep looking at this space for regular and daily updates about the markets.

Please do
subscribe to my posts, so that all posts are delivered free to your inbox and you don't miss any useful analysis of the markets in the future.

Happy Investing!!!

Read the Full Post Here

Friday, August 01, 2008

Narrow Range Day in Nifty Suggests Big Movement

The Nifty opened with very small gains today but converted them into small losses within the first minute only. It then recovered all that in the next 5 minutes only to lose it all back in the next 10 minutes. The recovery that then started took the Nifty up 40 points from its lows and lasted about an hour or so. And it took all of two hours to take it back beyond the lows of the day. And after 1pm it was slow and steady gains for the Nifty. On the whole, it was a day of extremely small but volatile movements. When the day ended, Nifty had a high price of 4342 and a low of 4285.55, a movement of 56.45 points in the full day. It was an extremely narrow range day, which was last seen in the Nifty only on 1st Jan 2008 when it had a range of 55.5 points in the day.

A narrow range day, like a doji, represents confusion or indecision. The markets are not sure what the next move would be. Both bulls, as well as the bears, do not have control on the markets. It is representative of being in a neutral territory. It is also representative of a ‘lull before the storm’. Now that we have seen the lull today, we should get ready for the storm. But in which direction will the storm come? Nobody knows for sure. But the price action tomorrow shall tell us. A move above today’s high should be bullish (4342) while a move below today’s low (4285) shall be bearish. As suggested in yesterday’s post, the chances of the markets going down are more than going up, because there is resistance close by and because of the pattern made in the charts.

Nifty Daily Chart - Narrow Range Day

Seen above is the daily chart of Nifty along with the Relative Strength Index (RSI). The RSI itself is not indicating right now but the trendline and trend channel is. As can be seen the downward sloping trendline is providing resistance to the Nifty at 4460 and support is near the top of the trend channel i.e. between 4180 and 4200. You can also see a minor resistance, as is pointed out by the brown arrow, at 4332. Why at 4332? Because the close today and close on Monday was at 4332, the high of the day on Tuesday was at 4332 and the high of Wednesday was 4327. So, it can be seen that in four days, the Nifty has been unable to cross this level of 4332, which means it is acting as a fairly strong support, at least in the short term. I, as an investor, would be willing to buy only above the previous pivot high of 4540, or at best, above 4460 when the trendline is broken through. I, as a short term trader would buy (in small quantities) above 4350 but would exit at the first sign of weakness. As a short term trader, I would also be willing to go short below today’s low of 4285 and then to adopt a wait and watch strategy near 4200. If some support is being found there, I will exit and if not, then increase my short exposure below 4160.

Please do
subscribe to my posts, so that all posts are delivered free to your inbox and you don't miss any useful analysis of the markets in the future.

Happy Investing!!!

Read the Full Post Here