The Nifty opened with very small gains today but converted them into small losses within the first minute only. It then recovered all that in the next 5 minutes only to lose it all back in the next 10 minutes. The recovery that then started took the Nifty up 40 points from its lows and lasted about an hour or so. And it took all of two hours to take it back beyond the lows of the day. And after 1pm it was slow and steady gains for the Nifty. On the whole, it was a day of extremely small but volatile movements. When the day ended, Nifty had a high price of 4342 and a low of 4285.55, a movement of 56.45 points in the full day. It was an extremely narrow range day, which was last seen in the Nifty only on 1st Jan 2008 when it had a range of 55.5 points in the day.
A narrow range day, like a doji, represents confusion or indecision. The markets are not sure what the next move would be. Both bulls, as well as the bears, do not have control on the markets. It is representative of being in a neutral territory. It is also representative of a ‘lull before the storm’. Now that we have seen the lull today, we should get ready for the storm. But in which direction will the storm come? Nobody knows for sure. But the price action tomorrow shall tell us. A move above today’s high should be bullish (4342) while a move below today’s low (4285) shall be bearish. As suggested in yesterday’s post, the chances of the markets going down are more than going up, because there is resistance close by and because of the pattern made in the charts.
A narrow range day, like a doji, represents confusion or indecision. The markets are not sure what the next move would be. Both bulls, as well as the bears, do not have control on the markets. It is representative of being in a neutral territory. It is also representative of a ‘lull before the storm’. Now that we have seen the lull today, we should get ready for the storm. But in which direction will the storm come? Nobody knows for sure. But the price action tomorrow shall tell us. A move above today’s high should be bullish (4342) while a move below today’s low (4285) shall be bearish. As suggested in yesterday’s post, the chances of the markets going down are more than going up, because there is resistance close by and because of the pattern made in the charts.

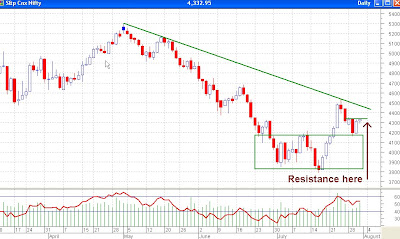
Seen above is the daily chart of Nifty along with the Relative Strength Index (RSI). The RSI itself is not indicating right now but the trendline and trend channel is. As can be seen the downward sloping trendline is providing resistance to the Nifty at 4460 and support is near the top of the trend channel i.e. between 4180 and 4200. You can also see a minor resistance, as is pointed out by the brown arrow, at 4332. Why at 4332? Because the close today and close on Monday was at 4332, the high of the day on Tuesday was at 4332 and the high of Wednesday was 4327. So, it can be seen that in four days, the Nifty has been unable to cross this level of 4332, which means it is acting as a fairly strong support, at least in the short term. I, as an investor, would be willing to buy only above the previous pivot high of 4540, or at best, above 4460 when the trendline is broken through. I, as a short term trader would buy (in small quantities) above 4350 but would exit at the first sign of weakness. As a short term trader, I would also be willing to go short below today’s low of 4285 and then to adopt a wait and watch strategy near 4200. If some support is being found there, I will exit and if not, then increase my short exposure below 4160.
Please do subscribe to my posts, so that all posts are delivered free to your inbox and you don't miss any useful analysis of the markets in the future.
Happy Investing!!!


No comments:
Post a Comment