The Nifty opened flat in the morning today and kept trading within a narrow range and was repeatedly finding resistance near 4420 and it wasn’t until 1PM, after the European markets opened, that it started rising again. The European markets closed very well in the day today with gains over 2 and a half percent since yesterday’s close. Even the Dow Jones right now is trading more than 200 points up in the green. Looking at the crude, after touching lows near $118, it is currently trading at $119.50. 118.20 to 118.50 seems to have provided good support to the prices today.
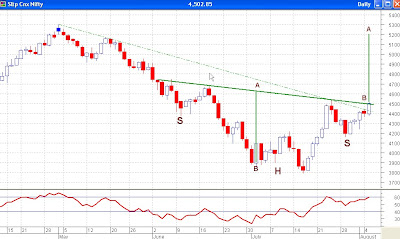
 Attached above is the daily chart of Nifty, along with a few trendlines drawn in and the Relative Strength Index (RSI). Let us start with the longest trendline in the chart which has been drawn from the beginning of May till date and which has been shown as a dotted trendline. This trendline was quite comfortably passed through during the day today. A second trendline, which happens to be shown as a solid line green in colour, has been drawn from the beginning of June till date. This also happens to be the neckline of the inverted head and shoulders pattern, which has been marked as S, H and S. A vertical line AB has been drawn from the neckline to the bottom of the head formation. This line has then been superimposed at the point of breakout (??) today. This superimposed line AB gives us a head and shoulders breakout target of 5200. It is not clear whether the head and shoulders pattern has been broken through or not yet. I feel it just fell short of confirming it. We would assume that this pattern has been confirmed if the previous pivot high at 4540 is surpassed, which happens to be another 40 points away. If that does happen the RSI also would cross 60, which would have happened in Nifty the first time in three months and only the second time since January, when the downfall started.
Is there anything that could go wrong? Yes, if it happens to be your bad day, everything could go wrong. Looking at the chart, we can see that the head and shoulders pattern has not been decisively confirmed today, which means that it could very well start coming down from here. Looking at the RSI too, we can see that the resistance at 60 has not been crossed as yet. If the Nifty turns down from here, 60 would not be crossed and it would be bearish for the index. If, on the other hand, the RSI crosses 60, we should be looking at further gains. On the downside, a move below 4140 would cancel this bullish head and shoulders pattern.
Please do subscribe to my posts, so that all posts are delivered free to your inbox and you don't miss any useful analysis of the markets in the future.
Happy Investing!!!


No comments:
Post a Comment